


INTRODUCTION
Gastric subepithelial tumors (SETs) are usually found incidentally as a firm protruding mass in individuals undergoing esophagogastroduodenoscopy (EGD). The diagnosis of gastric SETs is increasing in Korea because of the widespread use of endoscopy as part of a national screening program for gastric cancer. Its incidence was reportedly 0.76ŌĆÆ1.94% in recent studies [1,2]. Gastric SETs present as benign, potentially malignant, or malignant lesions. Most SETs have a benign clinical course. Some tumors, including lymphomas, gastrointestinal stromal tumors (GISTs), neuroendocrine tumors, and glomus tumors, are malignant or potentially malignant [3].
Gastric SETs are extremely difficult to differentiate using conventional endoscopy alone. Endoscopic ultrasonography (EUS) has been used to differentiate gastric SETs and plays a crucial role in confirming the diagnosis in some cases. However, it is particularly difficult to differentiate gastric SETs within the fourth (muscularis propria) echolayer [4]. Among them, GISTs and leiomyomas are the most common mesenchymal tumors noted in the muscularis propria of the stomach [5,6]. Distinguishing between GISTs and leiomyomas is essential to guide effective clinical management, as GISTs are potentially malignant, whereas leiomyomas are benign [7].
Although several studies have attempted to distinguish SETs based on EUS findings, their results were unsatisfactory [8,9]. Moreover, most were single-center retrospective studies with small sample sizes. Using EUS findings, this multicenter study aimed to elucidate predictive factors and subsequently create a predictive risk score model and nomogram for differentiating gastric GISTs and leiomyomas.
METHODS
Patients
We retrospectively reviewed the medical records of patients with histopathologically proven gastric GISTs or leiomyomas originating from the fourth layer who underwent EUS examinations at eight university hospitals (members of the Research Group for Endoscopic Ultrasound of the Korean Society of Gastrointestinal Endoscopy) between January 2005 and December 2015. For the immunohistochemical analysis, GISTs were defined as positive for c-KIT, while leiomyomas were defined as positive for desmin or smooth muscle actin.
We enrolled 361 patients (162 men and 199 women) with a mean age of 57 years (range, 26ŌĆÆ87 years), of whom 274 had GISTs and 87 had leiomyomas. The pathological findings were confirmed using tissues obtained surgically (306 patients [84.8%]), biopsy with endoscopic forceps (37 patients [10.2%]), EUS-guided fine-needle biopsy (EUS-FNB) (13 patients [3.6%]), or endoscopic resection (5 patients [1.4%]), including endoscopic mucosal resection or endoscopic submucosal dissection.
This study was performed in accordance with the ethical guidelines of the Declaration of Helsinki and approved by the Institutional Review Board of Konyang University Hospital (approval no. 2015-07-015).
Patient data
From the medical records including EGD and EUS images, we obtained data on patient demographics and tumor characteristics, including location (non-cardia, cardia), tumor shape (non-elongated, elongated), tumor growth pattern (endophytic, exophytic, mixed), and the presence of dimpling or ulcer, mucosal erythema, and lobulation. Data pertaining to maximal diameter, echogenicity (hyperechoic, isoechoic, hypoechoic), homogeneity (homogenous, heterogeneous), presence of anechoic spaces, presence of hyperechoic spots, and marginal regularity (regular, irregular) were recorded based on the EUS findings. Echogenicity was determined by comparison with the normal muscularis propria layer. The term ŌĆ£homogenousŌĆØ was defined as more than 75% of the total area appearing homogenous.
The interpretation of EUS images involves many inter-observer differences. Therefore, we collected three typical cases from each hospital and selected 20 cases worthy of discussion. Two consensus meetings were held on the EUS findings in these cases. After consensus meetings, the cases from each hospital were interpreted independently by endosonographers according to the criteria determined at the meeting, and the results were collected.
Statistical analysis
In this study, we evaluated the inter-observer agreement of the five EUS findings using FleissŌĆÖs kappa (─Ė) to compare their reliability. A ─Ė value of 1.0 indicates perfect agreement. Values of ─Ė>0.80 were considered ŌĆ£excellent,ŌĆØ 0.60ŌĆÆ0.79 were considered ŌĆ£good,ŌĆØ 0.40ŌĆÆ0.59 were considered ŌĆ£fair,ŌĆØ and <0.40 were considered ŌĆ£poor.ŌĆØ
Categorical variables were analyzed using the Žć2 test or FisherŌĆÖs exact test. Continuous variables were analyzed using StudentŌĆÖs t-test or the MannŌĆōWhitney U-test. Univariate binary logistic regression was used to assess the effectiveness of potential predictive factors in differentiating GISTs from leiomyomas in patients with SETs. A multivariate predictive model was then constructed using a backward stepwise variable elimination procedure including the predictive factors with values of p<0.1 in the univariate analysis.
Receiver operating characteristic (ROC) curve analysis was performed to measure the discrimination performance in the development and internal validation sets. The reliability of the constructed model was internally validated using leave-one-out cross-validation. For practical application of the prediction model in the clinical field, a nomogram was constructed using the selected predictors.
Statistical significance was set at p<0.05. The statistical analyses were performed using R version 3.3.3 (R Foundation for Statistical Computing, Vienna, Austria) and T&F program ver. 2.8 (YooJin BioSoft Co., Ltd, Goyang, Korea).
RESULTS
Inter-observer variability of the five EUS features
Before the first consensus meeting, the average ─Ė value for the inter-observer variability of the five EUS features was 0.178. Agreement for all EUS findings was poor, with a ─Ė value of <0.40. After the first consensus meeting, the average ─Ė value improved to 0.281, but the agreement was still poor. The agreement for homogeneity was fair (─Ė=0.41), but that for the other four EUS factors was poor. After the second consensus meeting, the average ─Ė value improved to 0.459, and the agreement was fair. There was good agreement for hyperechoic spots (─Ė=0.724), fair agreement for homogeneity and anechoic spaces (─Ė=0.459 and 0.507, respectively), and poor agreement for echogenicity and a marginal irregularity (─Ė=0.353 and 0.257, respectively) (Table 1).
Predictive factors differentiating GISTs from leiomyomas
The clinicopathologic characteristics and EUS findings are presented in Table 2. The maximum tumor sizes of GISTs and leiomyomas were 11.7 and 5.7 cm, respectively. On univariate analysis, GISTs were significantly associated with male sex, older age, non-cardia, dimpling or ulcer on the tumor surface, non-elongated shape, exophytic or mixed tumor growth pattern, absence of lobulation, large tumor size, higher echogenicity, tumor heterogeneity, and presence of anechoic spaces. The presence of hyperechoic spots, mucosal erythema, and irregular tumor borders were not significantly different between GISTs and leiomyomas.
The multivariate analysis revealed that heterogeneity (odds ratio [OR], 9.48; 95% confidence interval [CI], 3.30ŌĆō27.27), non-cardia (OR, 19.11; 95% CI, 9.36ŌĆō39.02), and older age (OR, 1.06; 95% CI, 1.02ŌĆō1.09) were independent predictive factors for differentiating gastric GISTs and leiomyomas originating from the fourth layer (Table 3; Fig. 1).
Predictive model for differentiating GISTs and leiomyomas based on EUS findings in patients with gastric SETs
Based on the results of the univariate and multivariate analyses, we selected six predictive factors and developed a predictive model for differentiating GISTs and leiomyomas that originate from the muscularis propria layer as shown below:
Probability to be case sample = e╬▓X / (1 + e╬▓X),
where ╬▓X = -4.044 + (0.056 ├Ś age) ŌĆō (0.706 ├Ś sex) + (2.25 ├Ś homogeneity) + (1.311 ├Ś anechoic spaces) + (2.95 ├Ś location) + (0.867 ├Ś ulceration or dimpling). In this predictive model, the values used were ŌĆ£0ŌĆØ for female sex, homogeneity, and absence of anechoic spaces, cardia, and absence of dimpling or ulcer, respectively. The values were ŌĆ£1ŌĆØ for male sex, heterogeneity, presence of anechoic spaces, non-cardia, and presence of dimpling or ulcer.
As this equation is too complex for use in the clinical field, a nomogram was constructed to estimate the predicted probability of the GISTs (Fig. 1). For each predictive factor in the nomogram, the point was read out by drawing a line straight upward from each predictor to the point axis. In the nomogram, the values were ŌĆ£0ŌĆØ for age <60 years, female sex, homogeneity, absence of anechoic spaces, cardia site, and absence of dimpling or ulcer. The values were ŌĆ£32,ŌĆØ ŌĆ£22,ŌĆØ ŌĆ£77,ŌĆØ ŌĆ£44,ŌĆØ ŌĆ£100,ŌĆØ and ŌĆ£18ŌĆØ for age 60Ōēź years, male sex, heterogeneity, presence of anechoic spaces, non-cardia site, and presence of dimpling or ulcer, respectively. The total points of these variables can be translated into the probability of risk.
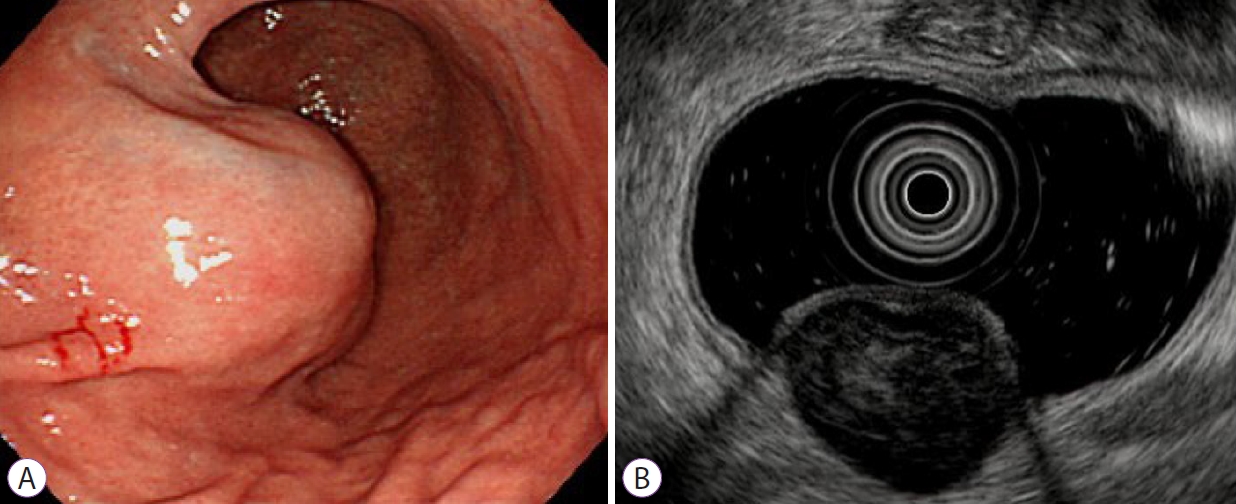
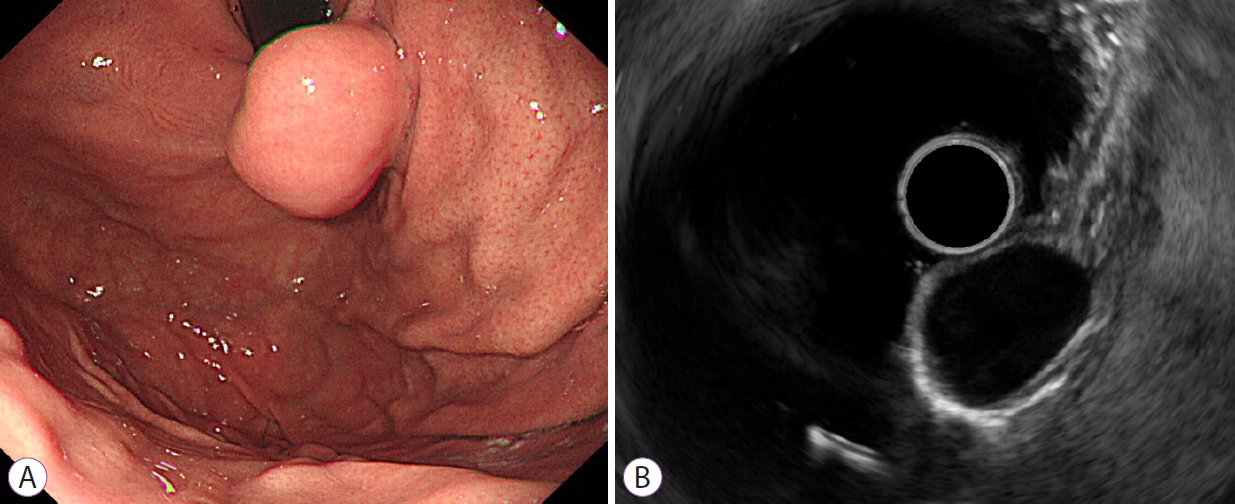
For example, in the representative GIST patient shown in Fig. 2, the sum of the values is 209 (age 60Ōēź years [32] + heterogeneity [77] + non-cardia site [100]), which corresponds to a risk probability of 0.994. This result is strongly predictable for GISTs. In the leiomyoma case shown in Fig. 3, the sum of the values is 22 (male sex [22]), which corresponds to a risk probability of 0.204. This result indicates a high probability of leiomyoma.
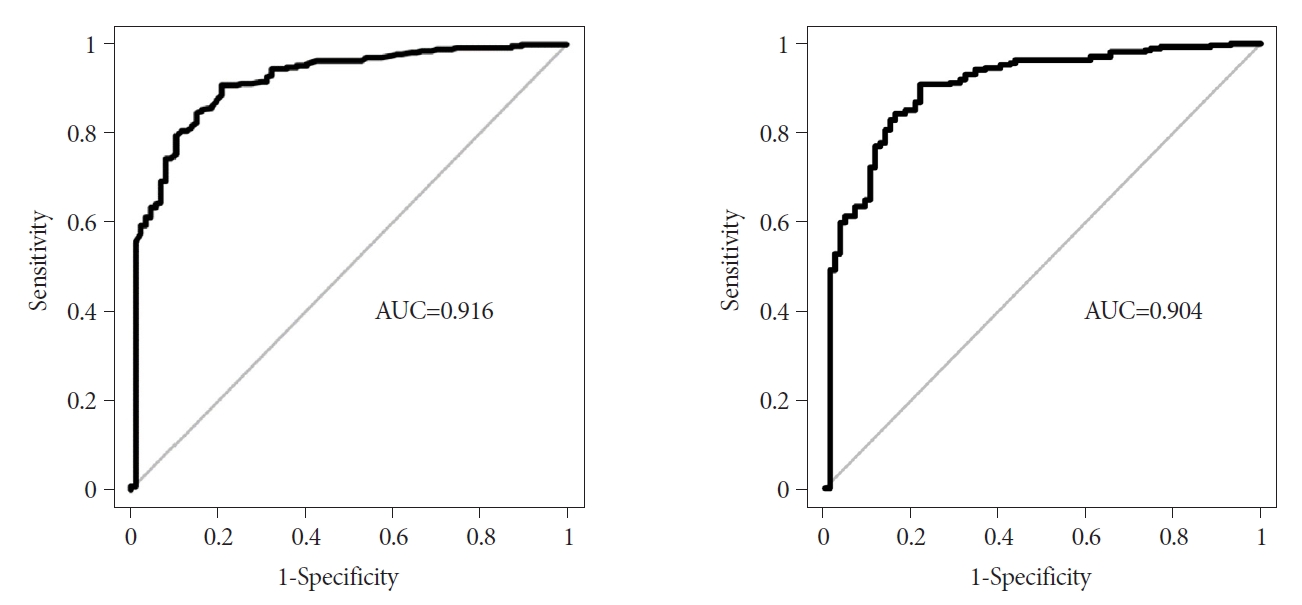
The area under the ROC curve of the predictive model was 0.916 (95% CI, 0.881-0.950) (Fig. 4). The optimal cutoff was 0.708, which was computed at the point maximizing YoudenŌĆÖs J statistic. In the development set, the sensitivity, specificity, accuracy, positive predictive value, and negative predictive value were 90.8%, 79.3%, 88.1%, 93.2%, and 73.4%, respectively.
The internal validation of this predictive model was assessed using a leave-one-out cross-validation procedure. The area under the ROC curve of the predictive model was 0.904 (95% CI, 0.867ŌĆō0.941), and the optimal cutoff value was 0.712. The ROC curves were similar between the developed model and the internal validation set, and the model showed good discriminative power in both datasets. In the internal validation set, the sensitivity, specificity, accuracy, positive predictive value, and negative predictive value, with a cutoff point of 0.712, were 90.8%, 78.2%, 87.8%, 92.9%, and 73.1%, respectively.
Predictive factors and model for differentiating GISTs from leiomyomas using tumors of different sizes
Tumors smaller than 2 cm
We found 121 gastric SETs <2 cm, including 77 GISTs and 44 leiomyomas. After univariate and multivariate analyses, age, sex, homogeneity, and tumor location were independent predictive factors for differentiating gastric GISTs and leiomyomas based on the EUS finding. The area under the ROC curve of the predictive model using age, sex, homogeneity, and tumor location was similar between the two datasets. In the development and internal validation sets, the area under the curve was 0.841 (95% CI, 0.762ŌĆō0.919) and 0.815 (95% CI, 0.731ŌĆō0.899), respectively.
Tumors with 2ŌłÆ3.5 cm in size
A total of 129 GISTs and 37 leiomyomas were 2.0ŌłÆ3.5 cm in size. After the univariate and multivariate analyses, age and homogeneity were independent predictive factors for distinguishing gastric GISTs and leiomyomas. The areas under the ROC curve of this predictive model with age, homogeneity, and sex in gastric SETs were 0.812 (95% CI, 0.733ŌĆō0.892) and 0.787 (95% CI, 0.7ŌĆō0.873) in the development and validation sets, respectively.
Tumors larger than 3.5 cm
There were 68 GISTs and 6 leiomyomas larger than 3.5 cm. After the multivariate analysis, age, tumor shape, and hyperechoic spots were independent predictive factors for differentiating gastric GISTs and leiomyomas. The area under the ROC curve of the predictive model using age, tumor shape, hyperechoic spots, and sex was 0.968 (95% CI, 0.922ŌĆō1.000) and 0.654 (95% CI, 0.248ŌĆō1.000) in the development and internal validation sets, respectively. This model showed good discriminative power in the development set but not in the validation set.
DISCUSSION
In this multicenter retrospective study, we aimed to investigate the predictive factors and develop a predictive risk score model and nomogram for differentiating gastric GISTs and leiomyomas based on EUS findings. The multivariate analysis identified heterogeneity, non-cardia, and older age as independent predictors of GISTs. The areas under the ROC curve of the predictive model using age, sex, and four EUS factors (heterogeneity, location, anechoic spaces, and dimpling or ulcer) were 0.916 (sensitivity, 0.908; specificity, 0.793) and 0.904 (sensitivity, 0.908; specificity, 0.782) in the development and internal validation sets, respectively.
EUS is the most valuable diagnostic tool for evaluating the layer of origin, size, internal echogenicity, margin, and echotexture of SETs [10]. However, although several studies have aimed to diagnose SETs using EUS, the diagnostic accuracy was relatively low for the differential diagnosis of such tumors, particularly for those that originate from the muscularis propria layer [8,9,11]. In addition, since the interpretation of EUS findings of gastric SETs has significant inter-observer variability, most studies of SETs have been single-center studies with small sample sizes [12]. Thus, we here planned a large sample size. Additionally, two consensus meetings were held to overcome inter-observer variability in the analysis of the EUS images, which is considered the largest problem with this approach. The first interpretation was based on existing personal criteria. The ─Ė values for inter-observer variability were very low (─Ė<0.40), and the agreement of the five EUS findings was poor. After the first meeting, the average ─Ė value improved to 0.28, but the agreement of four EUS findings, except homogeneity, remained poor. Consequently, we conducted an additional consensus meeting. The average ─Ė value of the third interpretation improved to 0.459 and the agreement was fair. The agreement for hyperechoic spots was good, whereas that for homogeneity and anechoic spaces was fair. Unfortunately, the agreement on the echogenicity and the marginal irregularity remained poor after the second meeting. To our knowledge, no report to date has evaluated the inter-observer agreement of EUS findings of gastric SETs. Despite these two meetings, the agreement improved only somewhat and not satisfactorily. Thus, we confirmed that the interpretation of EUS findings of gastric SETs has significant inter-observer variability.
In this study, GISTs were more common in the gastric antrum, body, and fundus. In contrast, leiomyomas were more common in the cardia. These results were similar to those reported in previous studies [13,14]. Most leiomyomas do not require surgery. In recent years, most SET operations have been performed using laparoscopic wedge resection. The cardia area is known to be a very difficult operation site because of the technical complexities of the procedure and complications such as gastroesophageal reflux or late stenosis [14]. When considering surgery in SETs in the cardia, efforts for preoperative pathologic diagnosis, such as EUS-FNB, unroofing technique, and single-incision needle-knife biopsy, are needed to avoid unnecessary surgery.
In a previous study, homogeneity, echogenicity, the presence of hyperechogenic spots and anechoic spaces, older age, and presence of a marginal halo were reported EUS findings for differentiating GISTs from leiomyomas [8,15,16]. In the present study, older age, tumor inhomogeneity, and non-cardia site were independent predictive factors for GISTs on multivariate analysis. In contrast, echogenicity, the presence of hyperechogenic spots and anechoic spaces, tumor shape, mucosal erythema, and marginal regularity were not helpful for predicting GISTs. In fact, among the important EUS findings, homogeneity was the only predictive factor.
The current study is the first to analyze the characteristics of tumor by size groups including tumors with 0.6ŌĆō11.7 cm in size. In SETs smaller than 2 cm, age, sex, homogeneity, and tumor location were significant independent predictive factors for differentiating GISTs and leiomyomas. In tumors with 2ŌłÆ3.5 cm in size, age and homogeneity were significant, while in tumors larger than 3.5 cm, age, tumor shape, and hyperechoic spots were significant.
In the development set, the area under the ROC curve in gastric SETs smaller than 2.0 cm, 2.0ŌĆō3.5 cm, and larger than 3.5 cm were 0.841, 0.812, and 0.968, respectively. We were mostly interested in gastric SETs with 2.0ŌłÆ3.5 cm in size, which decided whether to undergo surgery according to histopathology of SETs, but the discriminative ability of EUS was lowest for tumors of this size range.
Moreover, in the internal validation set, SETs smaller than 2.0 cm and with 2.0ŌłÆ3.5 cm in size showed areas under the curve similar to those of the development set. However, SETs larger than 3.5 cm had a lower area under the curve, which was most likely due to the small number of leiomyomas larger than 3.5 cm.
In the present study, we developed a predictive risk score model for differentiating gastric GISTs and leiomyomas that originate from the muscularis propria layer based on EUS findings. If the SETs were diagnosed as GISTs with a cutoff level of 0.708, the sensitivity, specificity, and accuracy of our model were 0.908, 0.793, and 0.881, respectively. This level of accuracy was noteworthy. Therefore, this model might be a complementary method to various other methods currently applied for discrimination of GISTs.
However, this study has some limitations. First, it was retrospective and used endosonographic images; therefore, there might have been selection bias. Second, several endoscopists independently interpreted the EUS findings of the gastric SETs. Although two consensus meetings were held to reduce inter-observer variability, agreement ended up just ŌĆ£fairŌĆØ. Finally, this study included small SETs.
Despite these limitations, the present study is important because it involved a multicenter trial that used two consensus meetings to reduce inter-observer variability and included a relatively large number of patients with leiomyoma. In addition, no previous study performed an analysis by tumor size.
In conclusion, EUS features such as heterogeneity, non-cardia site, and older age were significant independent factors for differentiating gastric GISTs from leiomyomas. Additionally, the predictive model and nomogram developed in the present study, which uses age, sex, homogeneity, the presence of anechoic spaces, tumor location, and the presence of dimpling or ulcer, may be helpful for differentiating GISTs from leiomyomas.