


INTRODUCTION
The diagnosis of the nature of solid pancreatic lesions (SPLs) is one of the most difficult clinical challenges [1]. The limited ability of pancreatic endoscopic ultrasound (EUS) to determine the benign or malignant nature of SPLs is considered one of the major disadvantages of EUS despite the improvements in image resolution and quality. EUS-guided fine needle aspiration (EUS-FNA) is the most reliable diagnostic tool with a high specificity but a moderate sensitivity. EUS-FNA may yield false-negative results for malignancy and may be impossible to perform owing to technical difficulties or interposed blood vessels. As a result, efforts were made to overcome these limitations; most recent ultrasound processors are provided with a dedicated software called elastography, which allows imaging and quantification of the tissue hardness [2].
The principle of elastography depends on the fact that compression of a target lesion by an echoendoscopic probe creates a strain that differs according to the hardness and softness of the tissue. Thus, it is possible to differentiate benign (soft) tissues from malignant (hard) tissues by calculating the tissue elasticity. Strain is shown via different colors based on the elasticity of the tissue: Green indicates soft tissues, whereas blue indicates hard tissues. This evaluation of tissue elasticity is qualitative [3]. The quantitative analysis of tissue stiffness is now possible with the development of second-generation EUS elastography. The use of the strain ratio (SR) is the simplest method of quantifying tissue elasticity by comparing the elasticity of the target lesion with that of a selected reference area within the adjacent tissue. The most important advantage of EUS elastography is that it can provide the endoscopist with immediate data during real-time diagnostic evaluation, which can affect patientsт management by assessing the nature of the lesion and more accurately targeting FNA, without the need for costly devices or software or extensive training [2].
In this study, we evaluated the effectiveness of the elasticity score (ES) and SR in the differentiation of benign pancreatic lesions from malignant pancreatic lesions.
PATIENTS AND METHODS
Patients
Of 309 EUS examinations performed over the 2-year study period (from January 2016 to January 2018) at the EUS Unit of the Department of Gastroenterology of Mansoura Specialized Medical Hospital, Mansoura University (Egypt), pancreatic lesions were detected in 168 patients, 97 of them had solid-appearing pancreatic masses on EUS and were included in the study. No patient with an SPL was excluded during the study period to avoid selection bias. Nineteen patients were enrolled as controls (eight patients with chronic pancreatitis, six patients with inflammatory masses, and five patients with no pancreatic lesions who underwent EUS for extra-pancreatic causes). Twenty-two patients with cystic lesions, 18 patients with negative biopsy results, and 12 patients with missing data were excluded from the study.
The inclusion criteria were as follows: referral for EUS, definite SPLs detected on previous radiological studies, and dilated common bile duct with negative imaging study results. The exclusion criteria were as follows: cystic lesions or lesions with a predominant cystic area, contraindication to interventional endoscopy (e.g., coagulation disorders or unfitness for sedation), refusal to be involved in the study, and unknown final diagnosis. The study protocol was approved by our ethical committee, and written consents were obtained from all patients before the procedure.
Methods
The study was designed as a retrospective study to evaluate the effectiveness of the ES and SR in diagnosing SPLs. On the day of the procedure, eligible patients went to the endoscopy room for EUS examination under intravenous propofol sedation. EUS examination was performed in all patients using the Pentax linear echoendoscope EG3870UTK (PENTAX Medical, Tokyo, Japan) attached to the Hitachi Avius ultrasound system (Hitachi Medical Systems, Tokyo, Japan). All examinations were conducted by two endosonographers (AYA and HH). Elastography was used to evaluate the hardness of the SPLs. Theoretically, the hardness of malignant lesions is greater than that of inflammatory lesions. The hardness of the lesion is assessed by the degree of tissue distortion illustrated on a color map (from red to blue representing soft to hard areas, respectively). The ES and SR were determined during the examination, and finally, EUS-FNA was performed at the end of the procedure.
Elasticity score and strain ratio
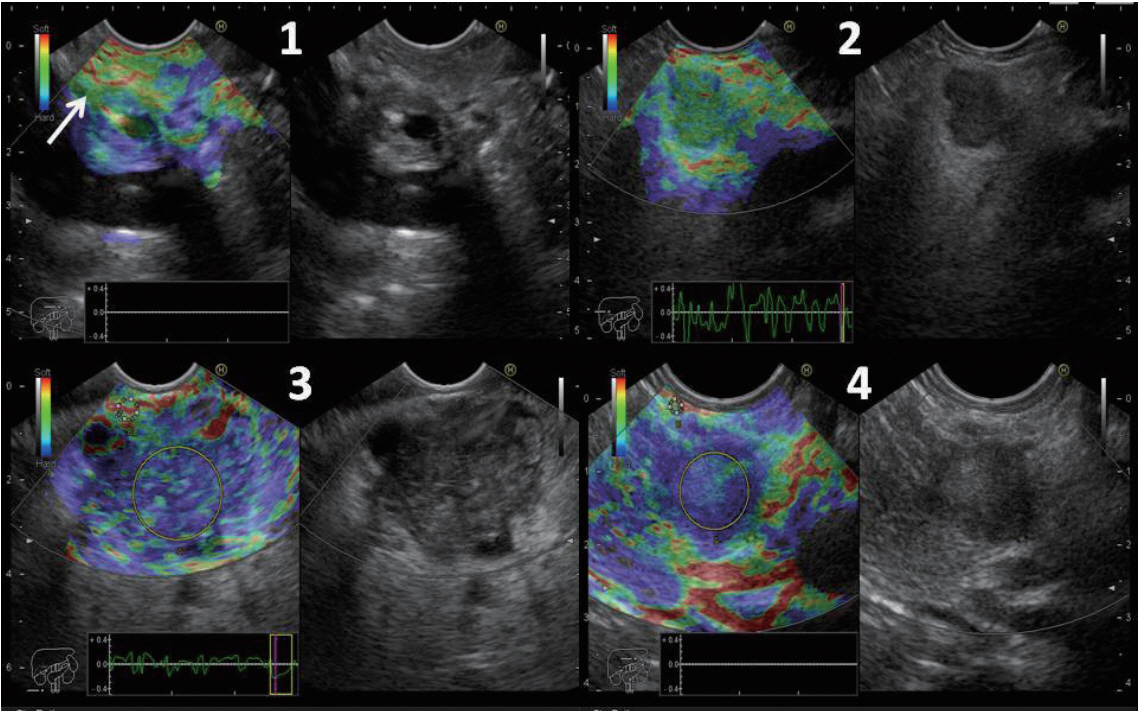
The ES was defined as follows: ES 1 was given to homogeneous green area and indicated normal tissues. ES 2 was given to heterogeneous green area predominant and indicated inflammation or fibrosis. ES 3 was given to heterogeneous blue predominant and indicated indeterminate for malignancy. ES 4 was given to homogeneous blue and indicated malignant lesions (Fig. 1).
The SR was calculated as follows: Two areas were selected; the region of interest was selected as area (A) and the normal reference tissue as area (B). Area (B) was then divided by area (A) (Fig. 1). The final SR was calculated from the mean of the repeated measures. Subsequently, the receiver-operating characteristic (ROC) curve was used to determine the best cutoff point and to calculate the diagnostic value of the SR. The best cut-off point of the SR was also combined with the ES to calculate the diagnostic value.
Statistical analysis
IBM SPSS for Windows (version 24) was used for calculating the means of the SRs, sensitivity, specificity, positive predictive value (PPV), negative predictive value (NPV), and accuracy. The best cut-off point was selected by comparing the diagnosis made on the basis of the ES and SR with the final diagnosis obtained via the cytopathological examination of the EUS-FNA samples or after surgical excision using the ROC curve; it was then used to calculate the diagnostic value. The Shapiro-Wilk test was used to check the normality of data and Studentтs t-test and Mann-Whitney test to assess parametric and non-parametric data, respectively, with 95% confidence intervals (CIs). P-values of тЄ0.05 were considered statistically significant.
RESULTS
In this 2-year study, 116 patients were enrolled (97 with malignant lesions and 19 with benign lesions). There were 69 men and 47 women. Their median age was 55.9 years (range, 12т78 years). The size, site, and final diagnosis of the pancreatic lesions, ES, and SR are shown in Tables 1 and 2.
ES 1 and 2 were deemed benign, while ES 3 and 4 were deemed malignant. The ES alone had a specificity of 89.5%, sensitivity of 99%, PPV of 98%, NPV of 94.4%, and accuracy of 97.4% (Table 3).
There was a significant difference between the mean SRs for benign SPLs (2.8) and malignant SPLs (29.4) (p<0.0001). Based on the ROC curve analysis results, the best cut-off point of the SR to obtain the maximum area under the curve was 4.55 with a specificity of 94.7%, sensitivity of 96.9%, PPV of 98.9%, NPV of 85.7%, and accuracy of 96.5%. Another cut-off point was detected at 7.75 with a specificity of 99.9%, sensitivity of 90.7%, PPV of 99.9%, NPV of 67.9%, and accuracy of 92.2%. After adding the ES to the SR, the cut-off point at 7.75 resulted in a specificity of 94.6%, sensitivity of 99%, PPV of 98%, NPV of 98.5%, and accuracy of 97% (Table 3).
DISCUSSION
The current study provides evidence supporting EUS elastography as a useful and accurate tool for differentiating the nature of solid pancreatic masses. The SR adds important and objective data to EUS, supporting the benign or malignant nature of the mass, by providing a quantitative analysis of tissue stiffness [4,5]. The SR provides a cut-off point for the differentiation between benign and malignant masses. Based on these results, and by using a well-defined reference method, EUS elastography can be used to define the benign or malignant nature of solid pancreatic masses objectively with high accuracy.
The high rate of false-negative results of EUS-FNA (up to 15%т17%) makes its diagnostic accuracy questionable [6]. Further, EUS-FNA has many disadvantages, including iatrogenic complications, need for repeated needle passes to acquire an adequate tissue sample [7], high learning curve, and high level of experience to obtain satisfactory results.
These disadvantages raised the necessity to improve other techniques for the diagnosis of solid pancreatic masses with fewer complications and higher efficacy. Dawwas et al. reported a sensitivity of 100% for the ES; however, it had a very low specificity of 16.7% [8]. This was in contrast to the results of other published studies [4,9] and our study that showed a specificity of 89.5%. In our study, two patients with ES 3 were finally diagnosed with inflammatory masses; this high ES may be attributed to the presence of fibrous tissues or calcifications. However, the subjectivity of the ES appeared to be a problem when using this technique.
The SR with different cut-off points was evaluated in many studies to overcome the subjectivity and increase the specificity of EUS elastography [4,8,10]. We found a cut-off point of 4.55, which had specificity, sensitivity, PPV, NPV, and accuracy of 94.7%, 96.9%, 98.9%, 85.7%, and 96.5%, respectively. This was similar to the results of the study by Okasha and colleagues [11], who reported a cut-off point of 3.8, which had NPV, sensitivity, and accuracy of 86%, 99%, and 96%, respectively, but lower specificity and PPV of 53% and 84%, respectively. Kongkam et al. [12] also reported a cut-off point of 3.17, which had lower specificity, sensitivity, PPV, NPV, and accuracy of 66.7%, 86.2%, 89.3%, 60%, and 81.6%, respectively. In our study, the best cut-off point for the differentiation between malignant and benign SPLs was 7.75. The SR of 7.75 had a specificity of 99.9%, sensitivity of 90.7%, PPV of 99.9%, NPV of 67.9%, and accuracy of 92.2%. The low SR in some malignant lesions may be attributed to degeneration or necrosis within the lesion.
In our study, the SRs were calculated for 97 consecutive patients with SPLs (78 with adenocarcinomas, eight with atypical lesions, four with neuroendocrine tumors, three with solid pseudopapillary tumors, two with undifferentiated carcinomas, and two with mixed adenocarcinomas with neuroendocrine tissue) and 19 patients with benign lesions. The SR was significantly higher among the patients with malignant pancreatic masses than among those with inflammatory masses. The inflammatory lesions exhibited an SR (mean, 2.8; 95% CI, 1.2т5.6) that was significantly lower than that of the pancreatic malignant lesions (mean, 29.4; 95% CI, 3.6т164; p<0.0001). These results were close to those of the study by Iglesias-Garcia et al. [13], who investigated the SR of 86 patients with SPLs (49 with adenocarcinomas, 27 with inflammatory lesions, six with neuroendocrine tumors, two with metastatic lesions from lung cancers, one with solid pseudopapillary neoplasm, and one with lymphoma) and 20 controls. The malignant pancreatic masses showed a significantly higher SR than did the inflammatory masses. The SR of the inflammatory masses (3.28) was significantly lower than that of the pancreatic adenocarcinomas (18.12); however, it was higher than that of the normal pancreatic tissues (p<0.001).
To increase the efficacy of differentiating malignant SPLs from benign SPLs, we combined the ES with the SR cut-off point of 7.75 to achieve a specificity of 94.6%, sensitivity of 99%, PPV of 98%, NPV of 98.5%, and accuracy of 97%, which is better than the use of each technique alone.
Elastography may have some limitations including as follows: Compression of the tissue by the echoendoscope is difficult to control; the motion artifacts created by respiratory and cardiac movements and some structures with very low or very high stiffness, such as major vessels or spine, are difficult to exclude from the region of interest. Most of these limitations can be reduced by experienced endoscopists. In our study, a stable elastography image for 5 seconds was required for elasticity measurement to minimize these limitations.
Despite all these theoretical limitations, we found that the use of the ES combined with the SR increases the accuracy of differentiation between benign and malignant SPLs and is an effective method for the evaluation of pancreatic masses.