Leem, Chung, Park, Bang, Song, Chung, and Park: Clinical Value of Contrast-Enhanced Harmonic Endoscopic Ultrasonography in the Differential Diagnosis of Pancreatic and Gallbladder Masses
Abstract
Background/Aims
Recent studies have revealed that contrast-enhanced harmonic endoscopic ultrasonography (CEH-EUS) is beneficial in the differential diagnosis of malignant neoplasms of the pancreas and gallbladder from benign masses, in terms of the evaluation of microvasculature and real-time perfusion. In this study, we aimed to prove the clinical value of CEH-EUS in the differential diagnosis of pancreatic and gallbladder masses by direct comparison with that of conventional EUS.
Methods
We reviewed the sonographic images and medical information of 471 patients who underwent conventional EUS and CEH-EUS for the diagnosis of pancreatic and gallbladder masses at a single medical center (Severance Hospital, Seoul, Korea) between March 2010 and March 2016.
Results
The enhancement pattern of CEH-EUS of the pancreatic solid masses showed higher sensitivity and specificity in differentiating pancreatic adenocarcinoma and neuroendocrine tumors (82.0% and 87.9% for pancreatic adenocarcinoma and 81.1% and 90.9% for neuroendocrine tumors, respectively), and the area under the receiver operating characteristic curves was higher than that of conventional EUS. The enhancement texture of CEH-EUS of the gallbladder masses showed a higher sensitivity in differentiating malignant masses than that of conventional EUS; however, the difference between the areas under the receiver operating characteristic curves was not statistically significant.
Conclusions
CEH-EUS can complement conventional EUS in the diagnosis of pancreatic and gallbladder masses, in terms of the limitations of the latter.
Keywords: Contrast-enhanced harmonic endoscopic ultrasonography; EUS; Pancreatic mass; Gallbladder mass
INTRODUCTION
According to the statistical research announced by the Ministry of Health and Welfare Korea in March 2015, the crude incidence rate of pancreatic cancer and gallbladder cancer has increased gradually since 1999: from 6.4/100,000 to 10.2/100,000 (pancreatic cancer) and from 5.5/100,000 to 10.7/100,000 (gallbladder cancer). Compared with those of other digestive tract cancers, their 5-year survival rates are relatively low: 8.8% and 28.3%, respectively. Therefore, early detection of these cancers and distinguishing them from benign masses are gaining importance.
Endoscopic ultrasonography (EUS) is widely used in diagnosing pancreatic and gallbladder diseases because of its higher spatial resolution than other imaging methods [ 1- 4]. However, EUS is limited by its inability to evaluate hemodynamics and vascularity. Therefore, many attempts have been made to complement these limitations, such as the use of Doppler EUS and contrast-enhanced EUS [ 5- 10]. Doppler EUS is limited in dynamic perfusion imaging and cannot depict very slow-flowing microscopic vessels and parenchymal perfusion [ 11, 12]. In contrast, contrast-enhanced harmonic (CEH) technology allows real-time perfusion imaging without Doppler-related artifacts [ 11, 12], and evaluation of both blood flow in small vessels (2 or 3 mm in minimum diameter) and parenchymal microvasculature [ 13]. Recently, CEH-EUS has been used to characterize solid pancreatic cancer and gastrointestinal stromal tumors [ 14, 15]. Ultrasound contrast agents consist of gas microbubbles covered by the shell of a biocompatible material, such as a protein, lipid, or polymer [ 16]. Until recently, contrast-enhanced imaging techniques for EUS were impossible to develop because all available echo-endoscope transducers were too small to produce sufficient acoustic power for CEH imaging using first-generation ultrasound contrast agents [ 16, 17]. However, second-generation ultrasound contrast agents, such as SonoVue (Bracco Inc., Milan, Italy), Definity (Lantheus Medical Imaging, North Billerica, MA, USA), and Sonazoid (Daiichi-Sankyo, Tokyo, Japan), are composed of stabilized microbubbles containing perfluorocarbons or sulfur hexafluoride, an echogenic and poorly soluble gas [ 16- 18]. They are markedly improved in peripheral circulation [ 18]. These second-generation ultrasound contrast agents produce harmonic signals at a lower acoustic power and are suitable for CEH-EUS imaging [ 15]. A recent meta-analysis on contrast-enhanced EUS that analyzed reports on both contrast-enhanced Doppler and CEH-EUS showed that this method can differentially diagnose pancreatic adenocarcinomas with a pooled sensitivity and specificity of 94% and 89%, respectively [ 19]. Moreover, for gallbladder neoplasms, a retrospective study on the use of CEH-EUS for differentiating gallbladder adenomas from cholesterol polyps showed that it was useful in differentially diagnosing gallbladder adenomas with a sensitivity and specificity of 75.0% and 66.6%, respectively [ 20]. These studies focused only on enhancement patterns for the differential diagnosis; however, we use more parameters than just enhancement or echoic patterns when we actually perform EUS. Therefore, we aimed to prove the clinical value of CEH-EUS in the differential diagnosis of pancreatic and gallbladder solid masses using a multi-parameter analysis in this study.
MATERIALS AND METHODS
Study design
We retrospectively reviewed the sonographic images and medical information of 471 patients who underwent conventional EUS and CEH-EUS for the diagnosis of pancreatic and gallbladder masses at a single medical center (Severance Hospital, Seoul, Korea) between March 2010 and March 2016. All endoscopic sonographies were performed by five pancreatobiliary endoscopy specialists (SWP, SYS, SMB, MJC and JYP), and each image was reviewed by two of the endoscopic physicians and blindly reviewed by one medical doctor (GLL).
Ultrasonography equipment
A radial echo-endoscope developed for CEH-EUS (GFUE260; Olympus Medical Systems Co., Tokyo, Japan) and a low acoustic power setting (mechanical index: 0.2) were used. Ultrasonography image analysis was performed using an Aloka ProSound Alpha-10 system (Aloka Co., Tokyo, Japan). After fundamental B-mode EUS was used to investigate the masses, the setting was changed to the extended pure harmonic detection mode, which combines the filtered fundamental and second harmonic component frequencies with a transmitting frequency of 5ŌĆō7.5 MHz. Thereafter, 2.5 mL of the contrast agent was injected into the antecubital vein in a bolus fashion through a 20-gauge intravenous cannula, followed by flushing with 5 mL of normal saline. SonoVue (Bracco) was used for the contrast agents. One ampule (2.5 mL) of SonoVue contains 25 mg lyophilized sulfur hexafluoride powder. The vascular structures were assessed in real time by examining continuous 0ŌĆō90-s images after contrast agent injection. Early enhancement patterns were shown from 30 to 45 s of the arterial phase, and late enhancement patterns were shown from 60 to 120 s of the venous phase.
Ultrasonography image analysis
The echogenic patterns of conventional EUS were classified into four categories: anechoic, hypoechoic, isoechoic, and hyperechoic. For pancreatic solid masses, these echogenic patterns were defined by comparing them with those of the normal pancreatic parenchyma. For gallbladder masses, these echogenic patterns were defined by comparing them with those of the gallbladder wall.
The enhancement patterns of CEH-EUS were classified into four categories: nonenhancement, hypoenhancement, isoenhancement, and hyperenhancement. These enhancement patterns were also defined by comparing them with those of the normal pancreatic parenchyma (in pancreatic solid masses) and those of the gallbladder wall (in gallbladder masses).
Other parameters that could be described using the sonographic images, such as duct dilatation, tumor size, tumor demarcation, tumor marginal irregularity, hypoechoic foci, and focal wall thickness, were obtained and used for the analysis.
Statistical analysis
All analyses were performed using the SPSS v. 20 (SPSS Inc., Chicago, IL, USA). First, we compared conventional EUS and CEH-EUS according to their sensitivities and specificities that were calculated depending on the EUS findings. Their discrimination abilities were evaluated using the classification table. Thereafter, we determined the statistically significant variables and obtained the receiver operating characteristic (ROC) curve and area under the curve (AUC) using logistic regression with the other parameters. They were calibrated with the Hosmer-Lemeshow test. Using a pairwise comparison of the AUCs, the clinical value of CEH-EUS was determined. P<0.05 was considered significant.
Patient population
Among the 471 patients reviewed, pancreatic masses were diagnosed in 279 patients and gallbladder masses in 192 patients. Among the 279 patients with pancreatic masses, 72 patients with cystic neoplasm of the pancreas were excluded. Among the 192 patients with gallbladder masses, 47 patients with gallbladder sludge not enhanced on CEH-EUS were excluded in the analysis.
RESULTS
Patient characteristics
Table 1 shows the baseline characteristics of the patients with pancreatic solid masses and gallbladder masses. Their mean age was 58.7 and 55.9 years, respectively, and all patients underwent conventional EUS and CEH-EUS for diagnosis. Among the pancreatic solid masses, ductal adenocarcinoma was the most common (45.9%), followed by neuroendocrine tumor (27.5%) and mass-forming pancreatitis (11.1%). Among the gallbladder masses, cholesterol polyps were the most common (30.7%), followed by adenocarcinoma (18.2%) and adenoma (7.8%).
Pancreatic solid mass
Supplementary Table 1 shows the vascular enhancement patterns of all 207 cases on CEH-EUS. With confirmed pathologic diagnosis, we measured the sensitivity and specificity for ductal adenocarcinoma and neuroendocrine tumor as hypoenhancement and hyperenhancement on CEH-EUS.
The sensitivity and specificity for ductal adenocarcinoma were 82.0% and 87.9%, respectively. Conversely, those for neuroendocrine tumor were 81.1% and 90.9%, respectively. Supplementary Table 2 shows the echogenic patterns of all 207 cases on conventional EUS; both ductal adenocarcinoma and neuroendocrine tumors were mostly hypoechoic, such that when we calculated their sensitivity and specificity, they showed a very low sensitivity and a relatively high specificity: sensitivity and specificity of 49.0% and 93.3% for ductal adenocarcinoma and 26.6% and 60.0% for neuroendocrine tumors, respectively. The diagnostic ability can be improved by considering the enhancement texture and echogenic texture together with the enhancement or echogenic pattern. When ductal adenocarcinoma was classified as having hypoenhancement and inhomogeneous patterns on CEH-EUS, the sensitivity and specificity were estimated as 85.7% and 89.4%, respectively. When ductal adenocarcinoma was classified as having hypoechoic and inhomogeneous patterns using conventional EUS, the sensitivity and specificity were estimated as 52.1% and 78.74%, respectively. When neuroendocrine tumors were classified as having hyperenhancement and homogeneous patterns using CEH-EUS, the sensitivity and specificity were 85.3% and 91.0%, respectively. When the tumors were classified as having hypoenhancement and homogeneous patterns using conventional EUS, the sensitivity and specificity were 52.1% and 84.9%, respectively.
Ductal adenocarcinoma
To evaluate the clinical value of CEH-EUS, we analyzed the enhancement patterns and echogenic patterns with other parameters that we obtained from EUS. To diagnose ductal adenocarcinoma using the sonographic images, we analyzed these parameters using logistic regression to determine which variables were statistically significant ( Table 2).
Table 2 shows that age, duct dilatation, tumor size, tumor demarcation, tumor marginal irregularity, hypoechoic pattern on conventional EUS, and hypoenhancement on CEH-EUS are significant factors in the univariate analysis. We created two groups and verified these factors using a multivariate analysis: one group with a hypoechoic pattern and the other with a hypoenhancement pattern. It revealed that age, hypoechoic pattern, duct dilatation, tumor size, and tumor marginal irregularity were statistically significant in the multivariate analysis of the conventional EUS setting; further, age, hypoenhancement pattern, duct dilatation, and tumor marginal irregularity were statistically significant in that of the CEH-EUS setting. Using logistic regression, we obtained the following predicted probability equations for each and their ROC curves ( Fig. 1A).
Predicted probability equation with conventional EUS: 1 / (1 + exp (-A)), where A = -7.888 + (0.052 ├Ś Age) + (2.770 ├Ś Hypoechoic) + (1.749 ├Ś Duct dilatation) + (0.028 ├Ś Tumor size) + (-0.497 ├Ś Tumor demarcation) + (2.695 ├Ś Tumor marginal irregularity). Predicted probability equation with CEH-EUS: 1 / (1 + exp (-A)), where A = -7.074 + (0.056 ├Ś Age) + (3.557 ├Ś Hypoenhancement) + (1.848 ├Ś Duct dilatation) + (0.016 ├Ś Tumor size) + (-0.808 ├Ś Tumor demarcation) + (2.953 ├Ś Tumor marginal irregularity).
Using a pairwise comparison of the ROC curves for ductal adenocarcinoma, the difference between the areas under the ROC curves (AUROCs) was 0.0602, which was statistically significant (p=0.001).
When we analyzed the parameters from conventional EUS and CEH-EUS together, the enhancement pattern of CEH-EUS was the single powerful parameter; thus, the echogenic pattern on conventional EUS lost its power and was no longer significant in the diagnosis.
Neuroendocrine tumor
With the same methods used for ductal adenocarcinoma, we repeated the analysis for neuroendocrine tumors ( Table 3). As mentioned before, the sensitivity for neuroendocrine tumors with a hypoechoic pattern was too low. Therefore, the hypoechoic pattern was not statistically significant at this time. Duct dilatation, tumor size, tumor demarcation, tumor marginal irregularity, and hyperenhancement pattern were statistically significant in the univariate analysis.
Table 3 reveals the factors that were statistically significant in the multivariate analysis: duct dilatation, tumor size, and tumor marginal irregularity for conventional EUS and hyperenhancement pattern, tumor size, and tumor marginal irregularity for CEH-EUS. Using logistic regression, we obtained the following predicted probability equations for each and their ROC curves ( Fig. 1B).
Predicted probability equation with conventional EUS: 1 / (1 + exp (-A)), where A = 0.952 + (0.171 ├Ś Hypoechoic) + (-2.374 ├Ś Duct dilatation) + (-0.056 ├Ś Tumor size) + (-0.252 ├Ś Tumor demarcation) + (-2.594 ├Ś Tumor marginal irregularity). Predicted probability equation with CEH-EUS: 1 / (1 + exp (-A)), where A = -0.259 + (3.287 ├Ś Hyperenhancement) + (-2.081 ├Ś Duct dilatation) + (-0.057 ├Ś Tumor size) + (-0.070 ├Ś Tumor demarcation) + (-1.699 ├Ś Tumor marginal irregularity).
Using a pairwise comparison of the ROC curves for neuroendocrine tumor, the difference between the AUROCs was 0.0744, which was statistically significant (p=0.0014).
Gallbladder mass
First, we focused on the differentiation of malignant masses from benign masses. There were 35 cases of malignant masses consisting of adenocarcinomas and carcinosarcomas and 110 cases of benign masses consisting of adenomas, adenomyomas, adenomyomatosis, cholesterol polyps, fundic gland polyps, pyloric gland polyps, hyperplastic polyps, cholesterolosis, and cholecystitis.
Unlike the pancreatic solid masses, the gallbladder malignant masses did not show any specific enhancement or echogenic patterns ( Supplementary Table 3). Therefore, we used the echogenic and vascular enhancement textures (homogenous or inhomogeneous) to differentiate the malignant masses. Malignant masses tended to be shown inhomogeneously both on conventional EUS and CEH-EUS ( Supplementary Table 4). When we diagnosed the malignant masses as having an inhomogeneous texture using conventional EUS, the sensitivity and specificity were 77.1% and 82.7%, respectively. Using CEH-EUS, the sensitivity increased up to 97.1%, and the specificity decreased to 55.5%. Regarding the importance of the sensitivity of the diagnosis tool for malignancy, CEH-EUS showed a competitive value. For further evaluation of the value of CEH-EUS, we analyzed the texture patterns with other parameters, including sex, age, hypoechoic foci, tumor size, multi-lobulated appearance, and number of lesions, using logistic regression ( Table 4).
Table 4 shows that age, hypoechoic foci, tumor size, multi-lobulated appearance, inhomogeneous echogenicity, and inhomogeneous enhancement are significant in the univariate analysis. We separated them into two groups (conventional EUS and CEH-EUS) and verified these factors using a multivariate analysis. In the conventional EUS group, hypoechoic foci, tumor size, and inhomogeneous texture on conventional EUS were significant. In the CEH-EUS group, hypoechoic foci, tumor size, and inhomogeneous texture on CEH-EUS were also significant.
To compare the two groups directly, we obtained the following predicted probability equations for each and their ROC curves ( Fig. 2) as we did for the pancreatic solid masses.
Predicted probability equation with conventional EUS: 1 / (1 + exp (-A)), where A = -4.137 + (2.483 ├Ś Hypoechoic foci) + (0.082 ├Ś Mass size) + (1.426 ├Ś Inhomogeneous texture in conventional EUS). Predicted probability equation with CEH-EUS: 1 / (1 + exp (-A)), where A = -6.760 + (2.718 ├Ś Hypoechoic foci) + (0.104 ├Ś Mass size) + (3.457 ├Ś Inhomogeneous texture in CEH-EUS).
Using a pairwise comparison of the ROC curves for malignant gallbladder masses, the difference between the AUROCs was 0.0270, which was not statistically significant (p=0.2383).
Thereafter, we further expanded our study to determine the clinical value of CEH-EUS in the differentiation of the surgical indication of gallbladder masses. We classified all gallbladder masses into two groups: neoplasm group, which requires surgery, and non-neoplasm group, which does not require surgery. The neoplasm group consisted of adenomas, adenocarcinomas, and carcinosarcomas, while the non-neoplasm group consisted of the other masses.
As shown in the malignant mass evaluation, the neoplasm and non-neoplasm groups also did not show any specific echoic or enhancement patterns. Therefore, we categorized them according to their vascular and echogenic textures: homogeneous or inhomogeneous. The neoplasms showed mostly an inhomogeneous enhancement pattern (80%); however, the non-neoplasms were not characterized by CEH-EUS. The sensitivity and specificity for the neoplasms with an inhomogeneous enhancement pattern were only 40.4% and 85.5%, respectively. Conversely, the non-neoplasms on conventional EUS at this time mostly showed a homogenous echoic pattern; however, the neoplasms did not show a specific pattern. The sensitivity and specificity for the neoplasms with an inhomogeneous echoic pattern were 60.9% and 82.0%, respectively, which imply that conventional EUS is still inappropriate as a diagnostic tool.
When analyzed with other parameters, only age and hypoechoic foci were the only statistically significant variables in both groups ( Supplementary Table 5). This reveals that EUS is not enough in determining the necessity of surgery in gallbladder masses.
DISCUSSION
To prove the clinical value of CEH-EUS in the differential diagnosis of pancreatic and gallbladder solid masses, we designed the study with following two aims: to compare the (1) sensitivity and specificity and (2) the ROC curves in the diagnosis. In this study, we proved the superiority of CEH-EUS in the differential diagnosis of pancreatic masses over conventional EUS with higher sensitivity, specificity, and AUROC for ductal adenocarcinoma and neuroendocrine tumor. For gallbladder masses, CEH-EUS showed its powerful value with a high AUROC in diagnosing malignant masses; however, its superiority over conventional EUS was not proven.
In the comparison of the diagnostic ability of the enhancement pattern and echogenic pattern of the pancreatic solid masses, the enhancement pattern showed higher sensitivity (82.0%) and specificity (87.9%) for ductal adenocarcinoma than the echogenic pattern (relatively low sensitivity [49.0%] and high specificity [93.3%]). Previous studies revealed that only with the enhancement pattern can the sensitivity and specificity be improved up to 95% [ 1, 3, 4]. However, it was not that precise in the actual clinical field. To improve the sensitivity and specificity, we considered the enhancement and echogenic textures together. Most cases of ductal adenocarcinoma showed an inhomogeneous texture; thus, considering the inhomogeneous texture together with the enhancement pattern could improve the diagnostic ability. When we classified ductal adenocarcinoma as having hypoenhancement and inhomogeneous patterns using CEH-EUS, the sensitivity and specificity increased up to 85.7% and 89.4%, respectively. When ductal adenocarcinoma was classified as having hypoechoic and inhomogeneous patterns using conventional EUS, the sensitivity and specificity increased up to 52.1% and 78.74%, respectively. In the neuroendocrine tumors, the changes were more dramatic. When the neuroendocrine tumor was classified as having hyperenhancement and homogeneous patterns using CEH-EUS, the sensitivity and specificity changed from 81.1% to 85.3% and from 90.9% to 91.0%, respectively, compared with that classified as having a hyperenhancement pattern only. When the neuroendocrine tumor was classified as having hypoenhancement and homogeneous patterns using conventional EUS, the sensitivity and specificity changed from 26.6% to 52.1% and from 60.0% to 84.9%, respectively, compared with that classified as having a hyperenhancement pattern only. After considering the texture with echogenic and enhancement patterns, CEH-EUS was still better in diagnosing ductal adenocarcinoma and neuroendocrine tumor than conventional EUS; however, the sensitivity and specificity were not as high as those in previous studies that reported nearly 95% for both. Therefore, we analyzed the parameters that physicians actually consider in the diagnosis together. In the logistic regression, the AUROC of CEH-EUS was 0.949 for ductal adenocarcinoma and 0.945 for neuroendocrine tumor. Considering that a model with AUC >0.75 is usually considered a powerful predictable model, we can conclude that the predictive model with the parameters of CEH-EUS is very powerful and rather precise. Although the model was not validated externally and the total patient numbers were not enough to create a scoring model, it can be concluded that the model is powerful in diagnosing ductal adenocarcinoma and neuroendocrine tumors precisely using the parameters of CEH-EUS. The calculated AUROC of conventional EUS for ductal adenocarcinoma and neuroendocrine tumor was 0.890 and 0.871, respectively, indicating that it is still a useful predictive model but is less powerful than CEH-EUS, with a statistical significance.
To prove the clinical value of CEH-EUS, we next present two example cases. The first case involves a 34-year-old male patient experiencing abdominal pain for 1 month. He had no family history of pancreatic cancer, and the levels of the tumor markers carcinoembryonic antigen and CA19-9 were within the reference ranges. On computed tomography (CT) scan, a 15-mm pancreatic mass was found. Considering his age, tumor marker level, and tumor size, the tumor was less likely pancreatic cancer, but rather possibly pancreatitis or another benign disease. He underwent CEH-EUS, which showed a hypoenhancement pattern, dilated pancreatic duct, and poorly demarcated and rough mass margin. Using the probability equation we created, his pancreatic lesion had a probability rate of 93.2% for ductal adenocarcinoma and 0.7% for neuroendocrine tumor. Therefore, he underwent surgery, and the pathology revealed pancreatic ductal adenocarcinoma. The second case is that of a 78-year-old female patient who was also experiencing abdominal pain for 2 weeks. She had no family history of pancreatic cancer, and the tumor marker levels were also in the reference ranges. On CT scan, a 15-mm pancreatic mass was found. Unlike the previous patient, this patient was old enough to raise suspicion for pancreatic cancer. On CEH-EUS, she had a hyperenhancement pattern, normal pancreatic duct, and well-demarcated and smooth mass margin. Using the probability equation we created, her pancreatic lesion had a probability rate of 7.8% for ductal adenocarcinoma and 89.8% for neuroendocrine tumor. Because of her old age, we planned surgical resection, and the pathology revealed a neuroendocrine tumor.
These two patients had similar pancreatic mass sizes. However, some features on CEH-EUS were different, and despite their unmatched age, the probability equation proved its precise ability of predicting ductal adenocarcinoma and neuroendocrine tumor. This would provide physicians more information on the diagnosis of pancreatic masses and help them in the treatment decision-making.
When we classified the malignant gallbladder masses with an enhancement pattern as what we did for the pancreatic solid masses, they did not have any specific enhancement pattern. This is similar to the result of a previous study [ 20]. Therefore, we used the echogenic and vascular enhancement textures (inhomogeneous or homogeneous) for the diagnosis of the gallbladder masses and showed that an inhomogeneous enhancement texture on CEH-EUS could be a single powerful diagnostic parameter for malignant masses with a sensitivity of 97.1%. Analyzed with other parameters from ultrasonography, CEH-EUS showed its clinical value with an AUROC of 0.939, but did not prove its superiority over conventional EUS ( p=0.2383). Expanding the study into the differential diagnosis of neoplasms, CEH-EUS still was not superior to conventional EUS. This would be because of the different characteristics between adenomas and adenocarcinomas; thus, grouping these two pathologies in the same group did not profit EUS.
There were some limitations in this study. This study performed a retrospective data analysis, and we did not measure the degree of enhancement quantitatively. However, the results were sufficient to prove the superiority of CEH-EUS in the differential diagnosis of pancreatic solid masses over conventional EUS. With the high sensitivity of the enhancement texture of malignant gallbladder masses, it could be useful in screening such masses. In addition, we can diagnose malignant masses with a high probability (AUROC of 0.939), if we consider the enhancement texture, size, and hypoechoic foci of the mass on CEH-EUS. Although the superiority was not statistically significant, CEH-EUS still shows its powerful clinical value.
CONCLUSIONS
Previously and widely used conventional EUS is limited in the evaluation of the microvasculature of diseases in the pancreas and gallbladder. In this study, we suggest that CEH-EUS has a high clinical value in the differential diagnosis of pancreatic masses and malignant gallbladder masses; thus, it can supplement the limitations of conventional EUS. Further studies that would consider the quantitation of enhancement and other diagnostic features are needed to overcome these limitations.
Fig.┬Ā1.
Comparison of the receiver operating characteristic (ROC) curve with predicted probabilities from contrast-enhanced harmonic endoscopic ultrasonography (CEH-EUS) and conventional EUS. (A) For ductal adenocarcinoma. The area under the ROC curve for CEH-EUS is 0.949 (SE 0.0140) and that for conventional EUS is 0.889 (SE 0.0220). (B) For neuroendocrine tumors. The area under the ROC curve for CEH-EUS is 0.945 (SE 0.0145) and that for conventional EUS is 0.870 (SE 0.0274). 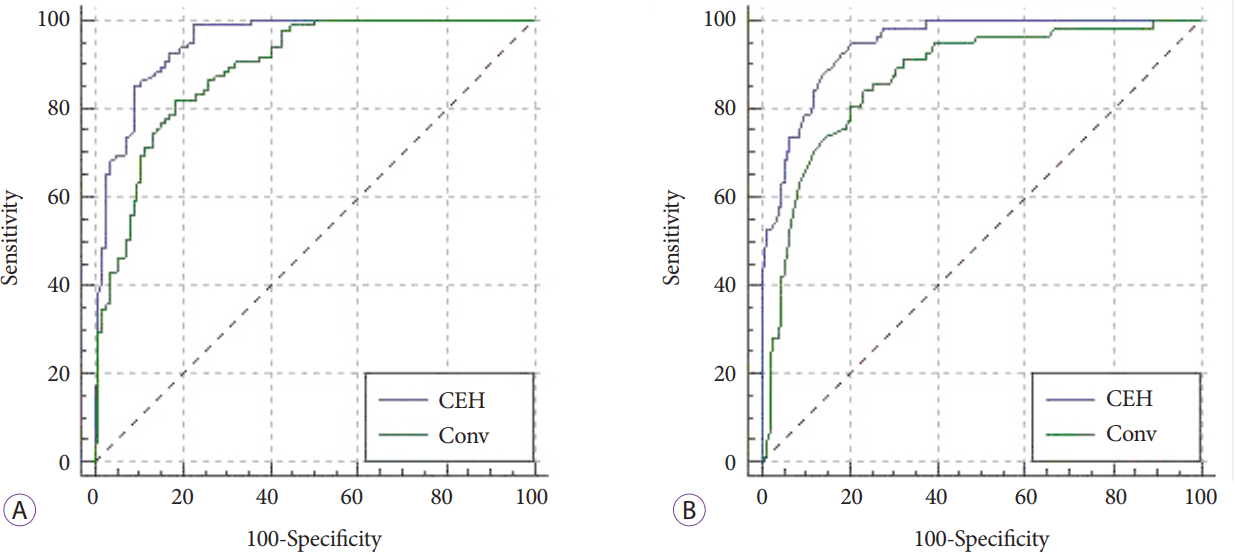
Fig.┬Ā2.
Comparison of the receiver operating characteristic (ROC) curve with predicted probabilities from contrast-enhanced harmonic endoscopic ultrasonography (CEH-EUS) and conventional EUS for gallbladder malignant masses. The area under the ROC curve for CEH-EUS is 0.939 (SE 0.0218) and that for conventional EUS is 0.912 (SE 0.0331). 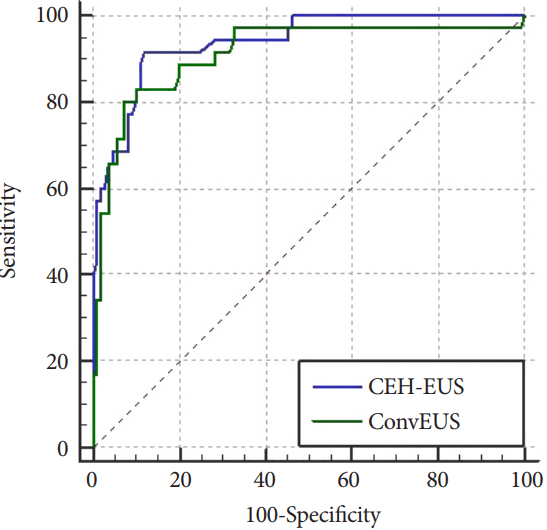
Table┬Ā1.
|
Pancreatic solid mass (n=207) |
Gallbladder mass (n=145) |
|
Age (mean┬▒SD) |
|
58.7┬▒13.9 |
55.4┬▒15.2 |
|
Sex (M/F) |
|
110/97 (53.1%/46.9%) |
58/87 (40.0%/60.0%) |
|
Diagnostic modality |
n (%) |
|
|
|
ŌĆāEUS |
|
207 (100) |
145 (100) |
|
ŌĆāCT |
|
205 (99.0) |
84 (57.9) |
|
ŌĆāMRI |
|
163 (78.7) |
35 (24.1) |
|
ŌĆāPET-CT |
|
144 (69.6) |
42 (29.0) |
|
Tumor size (mm) (mean┬▒SD) |
|
25.3┬▒15.0 |
15.6┬▒10.9 |
|
Tumor location |
n (%) |
|
|
|
|
Head/uncinate |
82 (39.6) |
Neck |
22 (15.2) |
|
Neck |
25 (12.1) |
Fundus |
51 (35.2) |
|
Body |
48 (23.2) |
Body |
72 (49.6) |
|
Tail |
52 (25.1) |
|
|
|
Pathology |
n (%) |
|
|
|
|
DA |
95 (45.9) |
Neoplasm (adenocarcinoma and adenoma) |
48 (33.1) |
|
NET |
57 (27.5) |
|
|
|
MFP |
23 (11.1) |
|
|
|
SPN |
14 (6.8) |
Non neoplasm |
97 (66.9) |
|
Others |
20 (9.7) |
|
|
Table┬Ā2.
Univariate and Multivariate Analysis of Variables for Ductal Adenocarcinoma
|
Variables |
Univariate |
Multivariate
|
|
Conventional EUS
|
CEH-EUS
|
|
Odds ratio (95% CI) |
p-value |
Odds ratio (95% CI) |
p-value |
Odds ratio (95% CI) |
p-value |
|
Age |
1.049 (1.025ŌĆō1.073) |
<0.001 |
1.053 (1.024ŌĆō1.084) |
<0.001 |
1.058 (1.018ŌĆō1.100) |
0.004 |
|
Sex |
0.785 (0.466ŌĆō1.325) |
0.365 |
|
|
|
|
|
Duct dilatation |
6.657 (2.606ŌĆō17.008) |
<0.001 |
5.748 (1.829ŌĆō18.060 |
0.003 |
6.344 (1.470ŌĆō27.379) |
0.013 |
|
Tumor size |
1.043 (1.021ŌĆō1.065) |
<0.001 |
1.029 (1.003ŌĆō1.056) |
0.030 |
1.016 (0.984ŌĆō1.049) |
0.333 |
|
Tumor demarcation |
3.442 (1.729ŌĆō6.852) |
<0.001 |
0.608 (0.210ŌĆō1.760) |
0.359 |
0.446 (0.112ŌĆō1.771) |
0.251 |
|
Tumor marginal irregularity |
13.372 (6.782ŌĆō26.366) |
<0.001 |
14.805 (5.859ŌĆō37.408) |
<0.001 |
19.167 (5.678ŌĆō64.705) |
<0.001 |
|
Hypoechoic |
13.429 (1.732ŌĆō104.144) |
0.013 |
15.955 (1.167ŌĆō218.136) |
0.038 |
|
|
|
Hypoenhance |
35.249 (16.155ŌĆō76.912) |
<0.001 |
|
|
35.071 (12.261ŌĆō100.315) |
<0.001 |
Table┬Ā3.
Univariate and Multivariate Analysis of Variables for Neuroendocrine Tumor
|
Variables |
Univariate |
Multivariate
|
|
Conventional EUS
|
CEH-EUS
|
|
Odds ratio (95% CI) |
p-value |
Odds ratio (95% CI) |
p-value |
Odds ratio (95% CI) |
p-value |
|
Age |
0.986 (0.964ŌĆō1.007) |
0.195 |
|
|
|
|
|
Sex |
1.635 (0.920ŌĆō2.906) |
0.094 |
|
|
|
|
|
Duct dilatation |
0.069 (0.009ŌĆō0.515) |
0.009 |
0.093 (0.011ŌĆō0.758) |
0.026 |
0.125 (0.012ŌĆō1.292) |
0.081 |
|
Tumor size |
0.922 (0.889ŌĆō0.955) |
<0.001 |
0.946 (0.914ŌĆō0.978) |
0.001 |
0.945 (0.908ŌĆō0.983) |
0.005 |
|
Tumor demarcation |
0.182 (0.062ŌĆō0.533) |
0.002 |
0.777 (0.193ŌĆō3.135) |
0.723 |
0.933 (0.180ŌĆō4.826) |
0.934 |
|
Tumor marginal irregularity |
0.047 (0.014ŌĆō0.158) |
<0.001 |
0.075 (0.020ŌĆō0.281) |
<0.001 |
0.183 (0.040ŌĆō0.840) |
0.029 |
|
Hypoechoic |
0.543 (0.184ŌĆō1.600) |
0.268 |
1.186 (0.349ŌĆō4.035) |
0.784 |
|
|
|
Hyperenhance |
43.000 (17.826ŌĆō103.722) |
<0.001 |
|
|
26.771 (9.633ŌĆō74.397) |
<0.001 |
Table┬Ā4.
Univariate and Multivariate Analysis of Variables for Gallbladder Malignant Masses
|
Variables |
Univariate |
Multivariate
|
|
Conventional EUS
|
CEH-EUS
|
|
Odds ratio (95% CI) |
p-value |
Odds ratio (95% CI) |
p-value |
Odds ratio (95% CI) |
p-value |
|
Sex |
1.263 (0.577ŌĆō2.762) |
0.559 |
|
|
|
|
|
Age |
1.093 (1.052ŌĆō1.136) |
<0.001 |
1.049 (0.998ŌĆō1.103) |
0.060 |
1.056 (0.998ŌĆō1.117) |
0.058 |
|
Hypoechoic foci |
27.818 (10.097ŌĆō76.643) |
<0.001 |
8.273 (2.223ŌĆō30.785) |
0.002 |
9.816 (2.777ŌĆō34.700) |
<0.001 |
|
Tumor size |
1.114 (1.066ŌĆō1.165) |
<0.001 |
1.062 (1.002ŌĆō1.124) |
0.041 |
1.086 (1.018ŌĆō1.158) |
0.013 |
|
Multi-lobulated |
3.185 (1.419ŌĆō7.149) |
0.005 |
2.563 (0.710ŌĆō9.255) |
0.151 |
1.332 (0.344ŌĆō5.163) |
0.678 |
|
Multiple lesions |
<0.001 |
0.998 |
|
|
|
|
|
ConvEUS inhomogeneous |
16.164 (6.371ŌĆō41.012) |
<0.001 |
4.166 (1.163ŌĆō14.918) |
0.028 |
|
|
|
CEH-EUS inhomogeneous |
42.327 (5.593ŌĆō320.290) |
<0.001 |
|
|
25.681 (2.579ŌĆō255.689) |
0.006 |
REFERENCES
1. DeWitt J, Devereaux B, Chriswell M, et al. Comparison of endoscopic ultrasonography and multidetector computed tomography for detecting and staging pancreatic cancer. Ann Intern Med 2004;141:753ŌĆō763.   2. Ngamruengphong S, Li F, Zhou Y, Chak A, Cooper GS, Das A. EUS and survival in patients with pancreatic cancer: a population-based study. Gastrointest Endosc 2010;72:78ŌĆō83, 83.e1-e2. 3. Khashab MA, Yong E, Lennon AM, et al. EUS is still superior to multidetector computerized tomography for detection of pancreatic neuroendocrine tumors. Gastrointest Endosc 2011;73:691ŌĆō696. 4. Ishikawa T, Itoh A, Kawashima H, et al. Usefulness of EUS combined with contrast-enhancement in the differential diagnosis of malignant versus benign and preoperative localization of pancreatic endocrine tumors. Gastrointest Endosc 2010;71:951ŌĆō959. 5. Sakamoto H, Kitano M, Suetomi Y, Maekawa K, Takeyama Y, Kudo M. Utility of contrast-enhanced endoscopic ultrasonography for diagnosis of small pancreatic carcinomas. Ultrasound Med Biol 2008;34:525ŌĆō532. 6. Becker D, Strobel D, Bernatik T, Hahn EG. Echo-enhanced color- and power-Doppler EUS for the discrimination between focal pancreatitis and pancreatic carcinoma. Gastrointest Endosc 2001;53:784ŌĆō789. 7. S─āftoiu A, Popescu C, Cazacu S, et al. Power Doppler endoscopic ultrasonography for the differential diagnosis between pancreatic cancer and pseudotumoral chronic pancreatitis. J Ultrasound Med 2006;25:363ŌĆō372. 9. Dietrich CF, Ignee A, Braden B, Barreiros AP, Ott M, Hocke M. Improved differentiation of pancreatic tumors using contrast-enhanced endoscopic ultrasound. Clin Gastroenterol Hepatol 2008;6:590ŌĆō597.e1. 10. S─āftoiu A, Iordache SA, Gheonea DI, et al. Combined contrast-enhanced power Doppler and real-time sonoelastography performed during EUS, used in the differential diagnosis of focal pancreatic masses (with videos). Gastrointest Endosc 2010;72:739ŌĆō747. 11. Kudo M. Various contrast-enhanced imaging modes after administration of levovist. In: Kudo M, editor. Contrast harmonic imaging in the diagnosis and treatment of hepatic tumors. Tokyo: Springer Japan; 2003. p. 22ŌĆō25.
12. Whittingham TA. Contrast-specific imaging techniques: technical perspective. In: Quaia E, editor. Contrast media in ultrasonography: basic principles and clinical applications. Berlin: Springer Berlin Heidelberg; 2005. p. 43ŌĆō70.
13. Hirooka Y, Itoh A, Kawashima H, et al. Contrast-enhanced endoscopic ultrasonography in digestive diseases. J Gastroenterol 2012;47:1063ŌĆō1072. 15. Sakamoto H, Kitano M, Matsui S, et al. Estimation of malignant potential of GI stromal tumors by contrast-enhanced harmonic EUS (with videos). Gastrointest Endosc 2011;73:227ŌĆō237. 16. Kitano M, Kudo M, Sakamoto H, Komaki T. Endoscopic ultrasonography and contrast-enhanced endoscopic ultrasonography. Pancreatology 2011;11 Suppl 2:28ŌĆō33. 17. Kitano M, Sakamoto H, Matsui U, et al. A novel perfusion imaging technique of the pancreas: contrast-enhanced harmonic EUS (with video). Gastrointest Endosc 2008;67:141ŌĆō150. 18. Schneider M, Arditi M, Barrau MB, et al. BR1: a new ultrasonographic contrast agent based on sulfur hexafluoride-filled microbubbles. Invest Radiol 1995;30:451ŌĆō457. 19. Gong TT, Hu DM, Zhu Q. Contrast-enhanced EUS for differential diagnosis of pancreatic mass lesions: a meta-analysis. Gastrointest Endosc 2012;76:301ŌĆō309. 20. Park CH, Chung MJ, Oh TG, et al. Differential diagnosis between gallbladder adenomas and cholesterol polyps on contrast-enhanced harmonic endoscopic ultrasonography. Surg Endosc 2013;27:1414ŌĆō1421.
|
|