Endoscopic Molecular Imaging: Status and Future Perspective
Article information
Abstract
During the last decade, researchers have made great progress in the development of new image processing technologies for gastrointestinal endoscopy. However, diagnosis using conventional endoscopy with white light optical imaging is essentially limited, and ultimately, we still rely on the histopathological diagnosis from biopsy specimens. Molecular imaging represents the most novel imaging methods in medicine, and the future of endoscopic diagnosis is likely to be impacted by a combination of biomarkers and technology. Endoscopic molecular imaging can be defined as the visualization of molecular characteristics with endoscopy. These innovations will allow us not only to locate a tumor or dysplastic lesion but also to visualize its molecular characteristics and the activity of specific molecules and biological processes that affect tumor behavior and/or its response to therapy. In the near future, these promising technologies will play a central role in endoluminal oncology.
INTRODUCTION
Gastrointestinal endoscopy has been widely used for detection, differentiation, and staging of neoplasia in the digestive tract and has made great progress during the last decade.1 Diagnostic accuracy can be enhanced by better training, more efficient techniques, and the development of new image-processing technologies;2 however, diagnosis using conventional endoscopy with optical characteristics is essentially limited because it is based on morphological changes and/or discoloration. Chromoendoscopy can enhance surface structure and is used to determine demarcation borders; however, it is not sensitive enough to detect early-stage cancer because the diagnosis still depends on the endoscopist's expertise and biopsy. Autofluorescence imaging has been used for lesions that are difficult to identify morphologically or are indistinguishable by white light endoscopy, and this technique is potentially applicable for the diagnosis of dysplastic lesions and early-stage cancers in the gastrointestinal tract.3 Optical digital enhancing methods such as narrow band imaging,4 flexible spectral imaging color enhancement,5 and i-SCAN6 are novel endoscopic techniques that can distinguish neoplastic and nonneoplastic lesions without a dye. Magnifying endoscopy in combination with an optical digital method has an obvious advantage in that it allows analysis of the epithelial pit pattern and the vascular network. Other techniques allow visualization of cell morphology on the micro-level, thus reflecting microscopic characteristics.7 Given the differing statuses of various optical imaging modalities, in 2008, Tajiri and Niwa8 proposed a consensus on how different endoscopic imaging techniques should be grouped and defined. They divided endoscopic imaging methods into five categories: conventional endoscopy, image-enhanced endoscopy, magnified endoscopy, endoscopic microscopy, and tomographic imaging (Fig. 1). Based on this classification, we are encouraged to resolve issues such as how to combine these techniques in diagnostic strategies, how to apply them in algorithms for therapeutic decisions, and how to standardize several morphological classifications utilized in these techniques, especially in the field of endoluminal oncology (Fig. 2).

Endoscopic imaging classification proposed by Tajiri and Niwa (modified by the authors). FICE, flexible spectral imaging color enhancement; NBI, narrow band imaging; AFI, autofluorescence imaging.

Strategy based on the imaging classification in endoluminal oncology. ESD, endoscopic submucosal dissection; EMR, endoscopic mucosal resection; OCT, optical coherence tomography; EUS, endoscopic ultrasound.
Molecular imaging represents the most novel imaging methods in medicine, and the definition of the term is still not established. It is broadly defined as the in vivo characterization and measurement of a biological process at the cellular molecular level9 or a technique that directly or indirectly monitors and records the spatiotemporal distribution of molecular and cellular processes for biochemical, biological, diagnostic, or therapeutic application.10 Positron emission tomography (PET) might be included in a wide concept of molecular imaging methods: the detection, spatial localization, and quantification of specific molecular targets and events that form the basis of pathologies.11 In the clinical setting of different medical specializations, a major paradigm shift has been rapidly taking place in imaging technology represented by PET. The future of endoscopic diagnosis is likely to be affected by a combination of biomarkers and technology,12 and endoscopic molecular imaging can be defined as visualization of molecular characteristics; it has been described as immunoscopy,13 bioendoscopy,14 and optical biopsy.15 Before endoscopic molecular imaging can be realized, three prerequisites must be available: 1) more target-specific and highly sensitive biomarkers for clinical use; 2) fluorochromes that have a high affinity for the markers and can produce a distinct signal; and 3) equipment to visualize the indicator at high resolution in real time. These innovations will allow identification of tumor location. In addition, they will be useful to: 1) differentiate malignant and benign polyps and ulcers; 2) minimize the number of biopsies and frequency of surveillance; 3) provide accurate preoperative identification of tumor margins; 4) evaluate the effectiveness of pharmacological therapy; and 5) detect local dysplasia in inflamed mucosa such as Barrett esophagus or ulcerative colitis. These new developments will also allow us to visualize a tumor's molecular characteristics and monitor the activity of specific molecules and biological processes that affect tumor behavior and/or its response to therapy.16,17 Additionally, endoscopic molecular imaging could greatly impact personalized medicine for treating cancer with the development of molecular targeting therapies.18 In this paper, we describe the advancement of this new technology and preview future perspectives in the developing molecular era in gastrointestinal endoscopy.
TARGET BIOMARKERS
Gastrointestinal cancer arises in every segment of the digestive tract: the esophagus, stomach, duodenum, small intestine, and colon. A large mucosal area has the potential for developing neoplastic lesions. However, the most common sites associated with cancer mortality reflect the role of particular organs as targets for the development of endoscopic molecular imaging. Thus, reports from Europe and the United States are focused on colorectal carcinoma and dysplasia in Barrett esophagus,19-21 whereas those from Japan focus on gastric cancer.22 Essentially, the causes of cancer vary by organ, and cancer is affected by many factors during its development.23 In terms of biomarkers, there are two different methods to detect a neoplasia: using epigenetic markers on tissues during cancer development or utilizing ligands produced by the developed cancer. Several kinds of molecules or epitopes can be targeted, such as those involved in genetic mutations in the APC, KRAS, and p53 genes, microsatellite instability,20,24 and apoptosis.25 Endostatin and proteases such as cathepsin B are upregulated in areas of focal invasion of colorectal carcinomas and in dysplastic adenomas.20,24,26 Epidermal growth factor receptor (EGFR),27,28 vascular endothelial growth factor (VEGF),29 and carcinoembryonic antigen (CEA),22 which are highly expressed in digestive tract cancers, are also important candidates. Mucin, a glycoprotein containing a large amount of sugar, is the main component of mucus, and the peptide structure of the mucin core protein has been determined. The specific expression of mucin in various digestive tract cancers has been studied.30 Based on the ability to measure it with a relatively high sensitivity, mucin is a useful biomarker that should be targeted. Currently, therapeutic antibodies are exploited and used in various diseases, including colorectal cancer, and this is particularly true for molecular imaging applications, in which imaging and therapeutic targeting are often the same.31
MOLECULAR PROBES
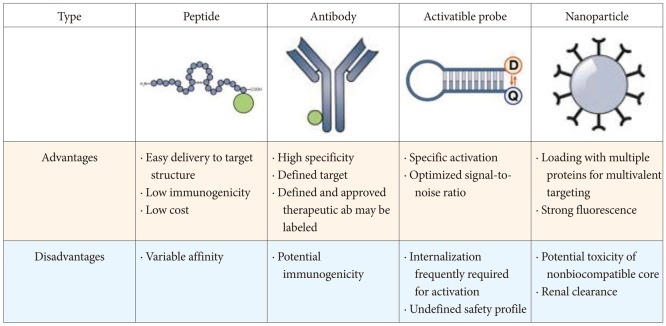
Principally, molecular probes are administered in an exogenous fashion and usually target a disease-specific biomarker. The best molecular probes are highly specific with a high tissue/background ratio and a high binding affinity to the targets. Such probes include antibodies, antibody fragments, peptides, nanoparticles, and activatable probes. Characteristic advantages and disadvantages exist among them (Fig. 3).32 The two most common classes of molecular probes being developed for clinical use include antibodies and peptides. Antibodies are Y-shaped γ globulins (immunoglobulin G) that are highly specific for known targets and have been translated into the clinical setting recently. They can be labeled with a variety of fluorescent dyes and have been developed for several molecular targets in EGFR, VEGF, CEA, and mucin. As diagnostic markers in molecular imaging, monoclonal antibodies have been and still are promising and efficient, but the sensitivity and specificity of immunofluorescence depend on those properties of native monoclonal antibodies. Conversely, antibodies may confer allergic reactions after systemic application, and their diffusion across epithelial borders and delivery to target structures are slow owing to their molecular weight.32 Peptides are short chains of amino acids that can be labeled with fluorescent dyes relatively easily and have been successfully selected using phage display techniques. Peptides are considered to have a high affinity for a specific partner and they should internalize, not remain cell-surface bound, to maximize cellular trapping and increase local concentration.33 Activatable probes are designed to generate fluorescence only after coming into contact with the target. These probes are fluorescently quenched in their native state and activated when they are cleaved by or react with tumor-associated enzymes, which play an important role in tumor proliferation, invasion, apoptosis, and metastasis.20,34
OPTICAL CONTRAST AGENTS
Components or elements of the living body emit fluorescence at 310 to 540 nm when excited at 280 to 370 nm. Infrared light has wavelengths between 700 and 1,000 nm that show higher permeation and safety than ultraviolet rays. Additionally, there is little background noise in the body, especially in the digestive tract, when infrared light is applied. Agents that are excitable by infrared light seem to be suitable for immunofluorescence. Near-infrared light includes wavelengths between 700 and 1,000 nm, and near-infrared fluorescence is widely applied for in vivo molecular imaging because of greater tissue penetration, less autofluorescence background, and reduced hemoglobin absorption.24,26,35 The Alexa Fluor dye family is produced by the company, Molecular Probes (Invitrogen, Carlsbad, CA, USA). These materials are synthesized through sulfonation of coumarin, rhodamine, xanthene, and cyanine dyes, and are often used as cell and tissue labels in fluorescence microscopy and cell biology. Alexa Fluor dyes are generally more stable and brighter than common dyes. The emission spectrum of the materials ranges from 442 to 810 nm. The IRDye family from LI-COR, HiLyte Fluor dyes from AnaSpec, and DyLight Fluor dyes produced by Dyomics in collaboration with Thermo Fisher Scientific (Hudson, NH, USA) are similar to Alexa Fluor dyes in spectrum characteristics and can be used alternatively. However, the toxicity of each material used for laboratory investigation should be considered before it is approved for clinical use. A strong affinity for the antibodies or peptides and intense fluorescence are also required for optimal probes. Quantum dots (QDs) are semiconductor nanocrystals that contain an inorganic core of metal and an outer soluble organic coating. They are highly fluorescent in the near-infrared region, nonradioactive, and easily visible deep within the tissues. In the clinic, they are applied for sentinel lymph node mapping and cancer imaging.36 However, the potential toxicity of QD is a limitation to their clinical use because they contain heavy metals at their core with an amphiphilic organic coating. Cadmium, telluride, selenide, and alkyl phosphines cause acute and chronic toxic disorders, although their toxicity as precomplexed nanocrystals is unknown.
Indocyanine green (ICG) is also a water-soluble fluorescent agent that emits light at 807 to 832 nm upon excitation around 770 nm.37 ICG is a clinically available compound that seems suitable as a molecular imaging agent;38 however, in the clinical use of these labeling agents, the toxicity of each labeled material should be evaluated before it is approved for clinical use. Moreover, several problems such as the affinity to antibodies, stability in the body, and intensity of fluorescent signal, should be solved before clinical use.
ADMINISTRATION OF CONTRAST PROBES
To utilize immunofluorescence in endoscopic diagnostics, it is essential that the probe shows in vivo immunofluorescence. This method uses exogenous diagnostic markers in a technique that is essentially different from newly developed autofluorescence imaging, which is based on endogenous fluorescence of materials such as collagen. The best way to administer the probe, by injection or topically, to a patient is controversial even now. Administration by injection is anticipated to reduce the affinity and decrease the fluorescence intensity of the markers during circulation because evoking the adverse effects of the markers demands large amounts of the antibody and the host-immune response to them quickly eliminates the antibody and forms immune complexes that damage the kidneys.39 For topical administration, tumor exposure is necessary for the reaction, and pretreatment of the gastrointestinal mucosa is necessary. In addition, it is necessary to develop an endoscope that has a diameter small enough for examination and flexibility as an instrument to allow normal observation at high definition and rapid switching to molecular imaging in real time. However, advances in technology will soon solve these problems.
RECENT PROGRESS AND FUTURE PERSPECTIVE
Molecular imaging was listed among the 10 emerging technologies that will change the world by the Massachusetts Institute of Technology 2003 Technology Review. Recently, in the United States, the National Institutes of Health launched common funding programs including molecular libraries and imaging. In the European Union, Diagnostic Molecular Imaging (DiMI) and European Master in Molecular Imaging (EMMI) programs were established. The DiMI Network of Excellence was one of the largest European research projects funded by the European Commission within the 6th Framework Programme. EMMI is an international program entirely dedicated to in vivo molecular imaging. Supported by the European Commission under the SOCRATES program, this 2-year interdisciplinary curriculum is formed by prominent European molecular imaging research groups. In response to these activities, the new World Molecular Imaging Society (WMIS), the world's most advanced molecular imaging organization, was formed from a merger of the Society for Molecular Imaging and the Academy of Molecular Imaging in North America. The World Molecular Imaging Congress is organized by the joint efforts of the WMIS, the European Society for Molecular Imaging, and the Federation of Asian Societies for Molecular Imaging. Given this situation, it is very likely that molecular imaging is one of the latest upcoming and nationwide fields that will affect human life science.
In general, the incidence of colorectal cancer has been increasing worldwide and will occur more frequently in the future; therefore, a new technology that is cost-effective and efficient in both screening and further examinations is required. Molecular imaging can add various types of information to conventional imaging techniques and can enable not only detection and localization but also quantification and determination of the pathological characteristics.11 Hsiung et al.21 detected in vivo human colonic dysplasia using a targeted heptapeptide and showed impressive images of a dysplastic polyp and the border between the normal mucosa and the lesion (Fig. 4). Based on their study showing specific changes in lectin binding patterns in the progression from Barrett esophagus to adenocarcinoma, Bird-Lieberman et al.40 recently succeeded in visualizing high-grade dysplastic lesions in Barrett esophagus that were not detectable by conventional endoscopy (Fig. 5). Recent concerns and analyses are shifting from in vitro to in vivo studies, from animals to humans, and from diagnostic issues to more therapeutically relevant subjects. Theragnostics (or theranostics), a term denoting the fusion of therapeutics and diagnostics, is receiving increasing attention as a key part of personalized medicine.41 Multidisciplinary approaches and collaborative research efforts by pharmaceutical scientists and medical doctors will lead to the discovery of clinically significant imaging and therapeutic agents that may help detect, differentiate, prevent, and cure cancer.

In vivo confocal fluorescence images of the border between a colonic adenoma and normal mucosa showing peptide binding to dysplastic colonocytes. (A) Endoscopic view. (B) Border. (C) Dysplastic crypt. (D) Adjacest mucosa. Scale bars, 20 µm.

Molecular imaging of an esophagectomy specimen with a 6-cm segment of Barrett esophagus containing macroscopically invisible residual high grade dysplasia (HGD) and focal intramucosal carcinoma. (A) Images taken with an endoscope. White-light image (left), imaging fluorescence at 490 to 560 nm before white germ agglutinin. Application (middle) and imaging fluorescence at 490 to 560 nm after wheat germ agglutinin (WGA) and Alexa Fluor 488 application (right). The areas of low WGA binding appear in purple. (B) The dashed white line is placed longitudinally along the posterior wall of the esophagus to facilitate orientation between the different images, and the numbers 7, 8, and 9 refer to the y coordinates on the reference grid in. White-light imaging of the lower esophagus revealed no macroscopic abnormalities such as ulcers or nodules, and before WGA application, we detected no appreciable differences in mucosal autofluorescence; however, after incubation with WGA, differences in lectin binding were evident. High binding is represented by a green signal and low binding is represented by a purple signal on the pseudocolor image. Grid showing the pathological diagnostic map (color-coded, with darker colors representing a worsening grade of dysplasia) of each block made from the resection specimen. This same grid can be compared with the endoscopic and in vivo imaging system (IVIS) fluorescence images in (A), on the right, and in (D). The dashed line represents the longitudinal axis along the posterior wall of the esophagus. (C) The same specimen after being opened longitudinally along the anterior border of the esophagus is shown with the overlying grid from (B). (D) The WGA fluorescence signal from the esophageal specimen taken with the IVIS 200 camera. The pink arrow marks an area of artifact from the exposed submucosal tissue, and the blue arrow indicates the site of a previous endoscopic mucosal resection (outlined with a dashed gray box). The specimen was cut into 11 transverse sections (rows labeled 1 to 11), and the pathologist divided each of these further into 8 areas (columns labeled A-H) to allow mapping. (E) Examples of the histological appearance (×40) at various coordinates from the grid. From left to right, the images show nondysplastic Barrett esophagus, low grade dysplasia (LGD), and two examples of HGD. The corresponding grid reference is given at the bottom of each image. Adapted from Bird-Lieberman et al. Nat Med 2012;18:315-321, with permission from Nature Publishing Group.40
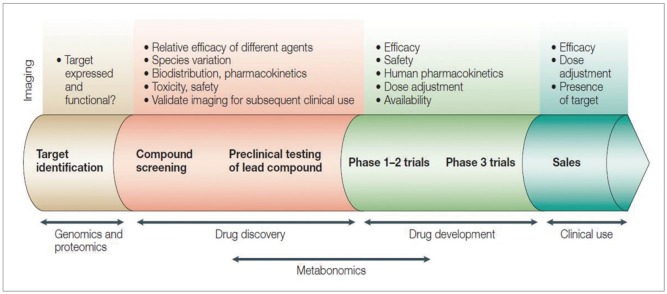
In clinical settings, amplification or reinforcement strategies are also required, because focal target concentrations are presumed quite low, in the picomolar to nanomolar range.42 An ideal system in this technology would be a less invasive modality that offers a strong signal to noise ratio, quantitative analysis, real-time monitoring, and multiplex imaging using various fluorescent peptides or antibodies with different optical characteristics.43 There are many alternate molecular pathways in carcinoma development; stepwise formation may be visualized with various molecules. Before the clinical application of molecular agents, pharmacokinetics and pharmacodynamics should be tested, and these agents must undergo lengthy approval processes (Fig. 6);31 however, no definite barriers are anticipated to prevent their eventual clinical application because therapeutic administration of various humanized antibodies has been proven safe. Conversely, fluorochromes such as ICG are photostable and have been used safely in the human body. With these possibilities, it seems apparent that this innovative technology will be realized in cooperation with the pharmaceutical industry and chemical and engineering companies, and we hope that the industry will economically invest in endoluminal oncology.
CONCLUSIONS
Endoscopic molecular imaging can be used for cancer screening and surveillance and can also provide important information for deciding treatment strategies and evaluating effectiveness. This technology will paly a central role in endoluminal oncology in the near future.
Notes
The authors have no financial conflicts of interest.