Advanced Imaging Technology Other than Narrow Band Imaging
Article information
Abstract
To improve the detection rate of gastrointestinal tumors, image-enhanced endoscopy has been widely used during screening and surveillance endoscopy in Korea. In addition to narrow band imaging (NBI) with/without magnification, various types of electronic chromoendoscopies have been used, including autofluorescence imaging, I-scan, and flexible spectral imaging color enhancement. These technologies enable the accurate characterization of tumors because they enable visualization of microvascular and microsurface patterns. The present review focuses on understanding the principle and clinical applications of advanced imaging technologies other than NBI.
INTRODUCTION
Various image-enhanced endoscopic systems are available in clinical practice [1]. For effective detection and histological prediction of lesions, endoscopists should understand the advantages and limitations of each imaging technology. Autofluorescence imaging (AFI) is a red-flag technology for detection of dysplasia or early cancer viewed on pseudo-color images. I-scan and flexible spectral imaging color enhancement (FICE) have a proprietary image processing algorithm applied on white light (WL) images that is based on spectral emission methods. In this review, I focused on presenting the detailed principle and clinical applications of advanced imaging technologies other than narrow band imaging (NBI).
AUTOFLUORESCENCE IMAGING
Principles
In humans, endogenous fluorophores (collagen, nicotinamide, flavin, and porphyrins) emit natural tissue fluorescence on excitation by light [2]. The AFI system detects these fluorophores with light of longer wavelengths (fluorescence) and produces real-time pseudocolor images on endoscopy monitor (Fig. 1) [3]. The overall fluorescence emission differs according to various tissue types. These are characterized by the corresponding differences in fluorophore concentration, metabolic state, and spatial distribution. On the basis of these color differences, AFI can detect and characterize significant abnormal lesions.
In AFI endoscopy, a special rotating color filter wheel generates blue light (390 to 470 nm) and green light (540 to 560 nm) in front of the xenon light source. An interference filter is situated in front of the AFI charge-coupled device (CCD). These CCD blocks the blue light excitation, whereas it allows tissue autofluorescence and reflects green light to the filter. In the AFI mode, normal or non-dysplastic mucosa typically shows green color, and a dysplastic lesion appears purple or magenta.
Clinical applicability
In a few studies, AFI was used to visualize squamous cell carcinoma (SCC) of the esophagus. For superficial esophageal carcinoma, AFI was less useful than NBI and Lugol chromoendoscopy [4]. In contrast, AFI could detect 79% of superficial esophageal SCCs, compared to only 51% by white light endoscopy (WLE) (p<0.05) [5].
In Western countries, AFI endoscopy was evaluated to determine improvement in the detection rates of early neoplasia in patients with Barrett’s esophagus (BE). However, AFI had an acceptable sensitivity but poor specificity for surveillance of BE [6-9]. In a study, AFI increased the detection rate of high-grade intraepithelial neoplasia (HGIN) in patients with BE, when combined with NBI [7]. Because all lesions were detected with AFI alone, it was considered as a red-flag technique to detect suspicious lesions. AFI combined with NBI enables close observation of the mucosal surface pattern. Therefore, AFI-NBI combination may increase the accuracy of detecting HGIN in BE. In an international multi-center study, the detection rate of early neoplasia improved in patients with BE when the AFI system was used in addition to high-resolution WLE. After the detected lesions were observed again using NBI, the false-positive rate of AFI alone decreased [8].
In a study, AFI was used to diagnose chronic atrophic fundal gastritis [10]. When the gastric body was observed using AFI, the non-atrophic mucosa was purple, whereas Helicobacter pylori-infected atrophic mucosa was green. The diagnostic accuracy of the mucosa that appeared green demonstrated 64% activity, 93% inflammation, 88% atrophy, and 81% intestinal metaplasia. In the gastric body, green areas showed more atrophy (p<0.001) and intestinal metaplasia (p<0.001), compared to purple areas. In comparison with WLE, AFI had a higher accuracy rate for the diagnosis of the endoscopic atrophic border in patients with chronic atrophic fundal gastritis. During surveillance endoscopy after endoscopic submucosal dissection of early gastric cancer (EGC), open-type, atrophic gastritis was diagnosed using AFI. This gastritis was significantly associated with the presence of metachronous gastric cancer (p=0.018) [11].
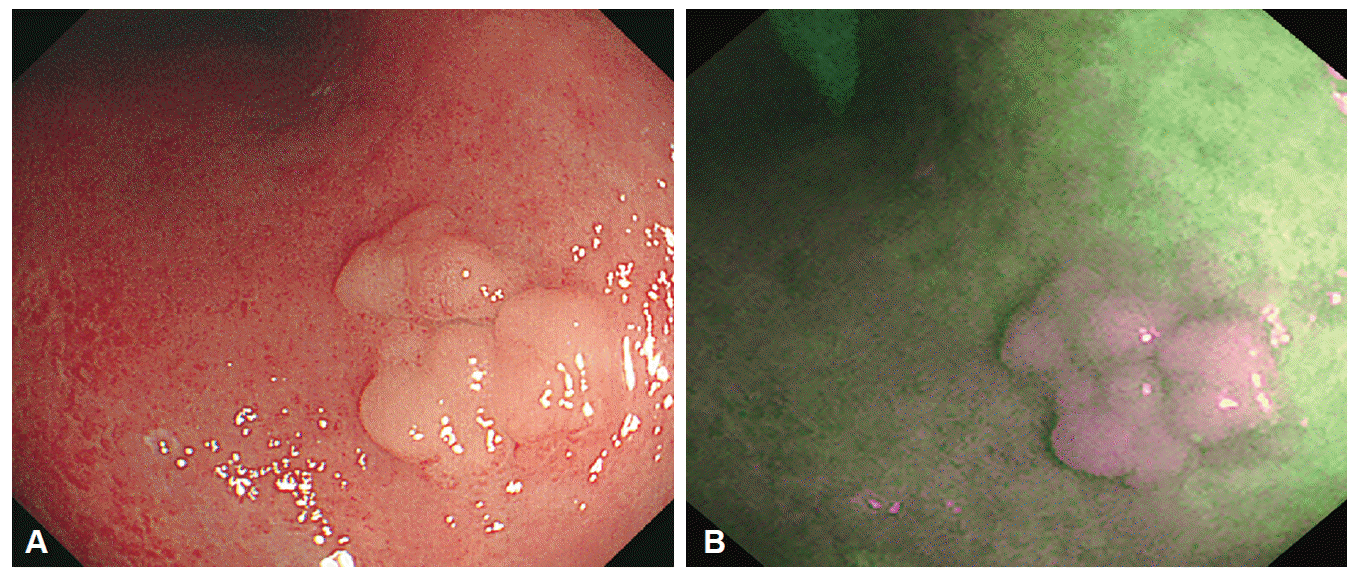
A prospective blinded study compared the diagnostic accuracy for the detection of superficial gastric neoplasia between AFI and WLE [12]. The sensitivities were similar between AFI and WLE (64% vs. 74%), whereas the specificity of AFI was lower than that of WLE (40% vs. 83%, p=0.0003). In another study, the sensitivity of AFI for pathology-proven gastric neoplasia was 68.1%, whereas the specificity was only 23.5% [13]. However, AFI showed a good diagnostic efficacy for determining the lateral margin of EGCs and its accuracy was similar to that of indigo carmine chromoendoscopy [14]. In clinical practice, AFI can clarify the margin of gastric neoplasia (Figs. 2, 3). Otani et al. [15] reported that AFI endoscopy was also helpful for evaluating the depth of tumor invasion in gastric cancers without ulceration.

Endoscopic images of tubular adenoma. (A) A conventional white light image showing an elevated tumor with surface nodularity. (B) An autofluorescence image showing the tumor as a purple area in a green background.

Endoscopic images of undifferentiated-type early gastric cancer. (A) A conventional white light image. Irregular reddish mucosa observed at the gastric angle. However, tumor margin cannot be differentiated because of similar color of the background mucosa. (B) An autofluorescence image. The tumor appears as purple nodules with a well-defined, green-colored margin.
During colonoscopy, the clinical significance of AFI in the detection of colon neoplasms remains controversial [16]. In a pilot study, AFI showed a lower miss rate of colon polyps compared to WLE (30% vs. 49%, p=0.01) [17]. In a Japanese study, AFI with a transparent hood also increased the detection rate of colorectal neoplasms compared to WLE alone [18]. A Dutch study demonstrated that AFI was useful for detecting dysplasia during surveillance colonoscopy in high-risk patients (ulcerative colitis, Lynch syndrome, and familial colorectal cancer) [19]. However, other two studies reported that AFI did not improve the colon adenoma miss-rate owing to low specificity (35% and 37%) [20-22].
I-SCAN
Principles
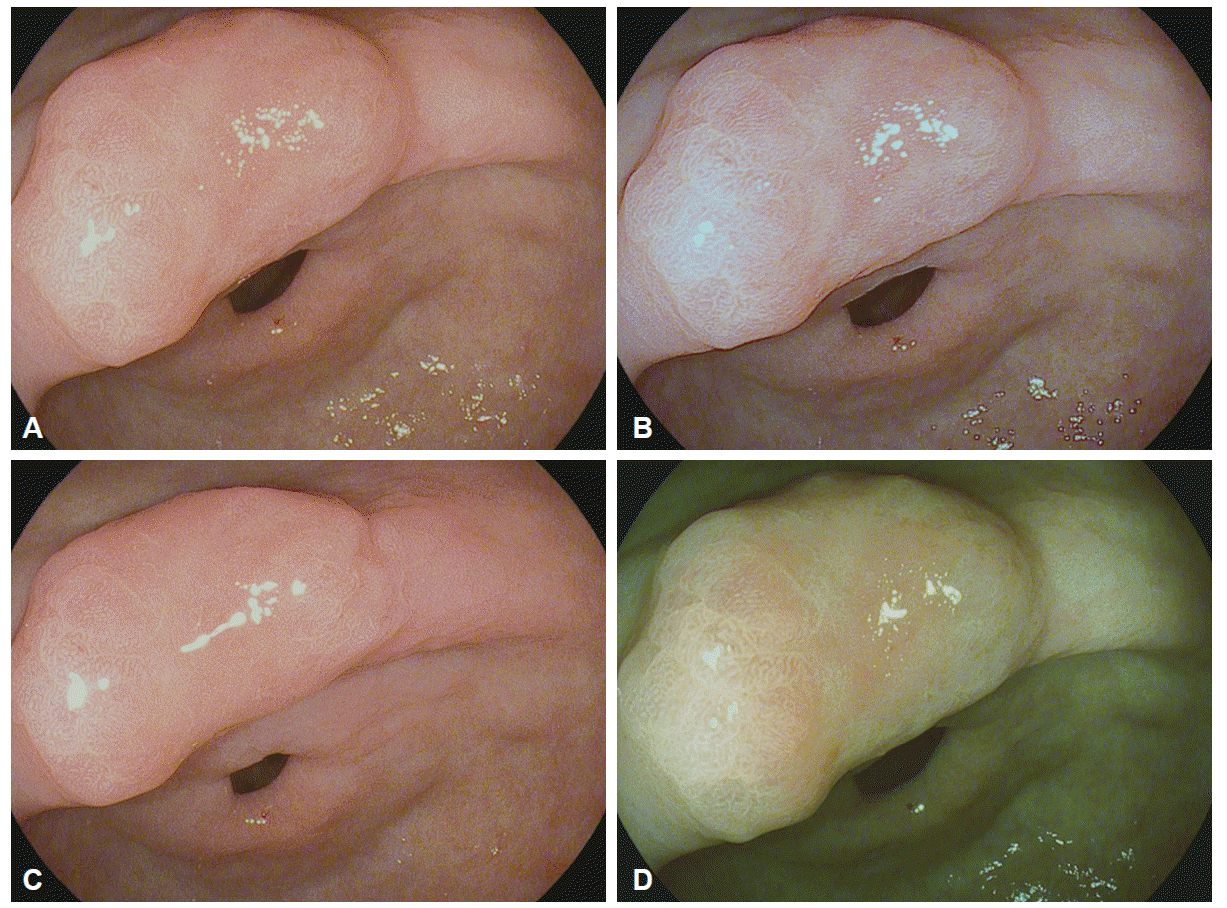
I-scan technology is the newly developed image-enhanced endoscopic technology from PENTAX (Tokyo, Japan) [23,24]. This technology consists of three types of algorithms: surface enhancement (SE), contrast enhancement (CE), and tone enhancement (TE) (Fig. 4). SE allows a detailed inspection of the mucosal surface structure. CE allows close observation of subtle irregularities and mucosal vascular pattern around the surface. SE and CE modes are suitable for screening endoscopy to detect an early-stage gastrointestinal tumor. TE consists of three modes such as TE-e for the esophagus, TE-g for the stomach, and TE-c for the colon. TE is mainly appropriate for additional characterization of detected lesions during screening endoscopy. Three modes (SE, CE, and TE) are serially converted by pressing a button, and two or more modes can be applied simultaneously (Fig. 5).

Principle of tone enhancement by the post-image acquisition software in the I-scan endoscopy system (Courtesy of Pentax, Tokyo, Japan).
Clinical applicability
In a study by Hoffman et al. [25], the diagnostic efficacy of I-scan for reflux esophagitis was compared to that of chromoendoscopy with Lugol`s solution. The results indicated that I-scan was simple and useful for evaluating the reflux-associated lesions. In Korea, a total 514 subjects were enrolled into a prospective randomized controlled trial [26]. Compared to WLE, I-scan endoscopy increased the diagnostic yield of reflux esophagitis by detecting more minimal changes in the squamo-columnar junction of the esophagus. When endoscopic still images were reviewed later, interobserver agreement was acceptable on the basis of Los Angeles classification. Another study also reported that I-scan improved the identification of minimal changes in patients with reflux symptoms [27].
Currently, only limited data are available on the use of I-scan for gastric lesions. When a superficial lesion of less than 1 cm in size was detected during WLE, I-scan endoscopy with magnification was performed for the diagnosis of gastric neoplasia [28]. Although the histologic prediction of small superficial gastric lesions was feasible, further studies will be required to confirm its value.
Using I-scan colonoscopy, many studies for the detection and characterization of colon polyps have been performed. A comparative study reported that I-scan was similar to chromoendoscopy using methylene blue for predicting colonic neoplasia [29]. In another study, I-scan colonoscopy detected a significantly high number of patients with colorectal neoplasia compared to standard colonoscopy (38% vs. 13%) [30]. In contrast, Hong et al. [31] demonstrated that screening colonoscopy using the I-scan system did not increase adenoma detection rate and prevented polyps from being missed during detection. However, I-scan was effective for histologic prediction of colorectal polyps compared to WLE. After a short training session and a review of standardized images, a learning curve was obtained rapidly [32]. When eight expert endoscopists were invited, I-scan colonoscopy showed a good interobserver agreement in the differentiation of neoplastic and non-neoplastic lesions [33]. In terms of the real-time histologic prediction of diminutive colon polyps, I-scan colonoscopy was similar to the NBI system [34].
In patients with inflammatory bowel diseases (IBDs), Neumann et al. [35] evaluated whether I-scan has the potential to increase assessment of disease severity and extent. Compared to WLE, the I-scan system showed significant differences in evaluating the extent of inflammation (49% vs. 92%) and disease activity (54% vs. 90%). This result has new implications for decision making in the management of IBD.
FLEXIBLE SPECTRAL IMAGING COLOR ENHANCEMENT
Principles
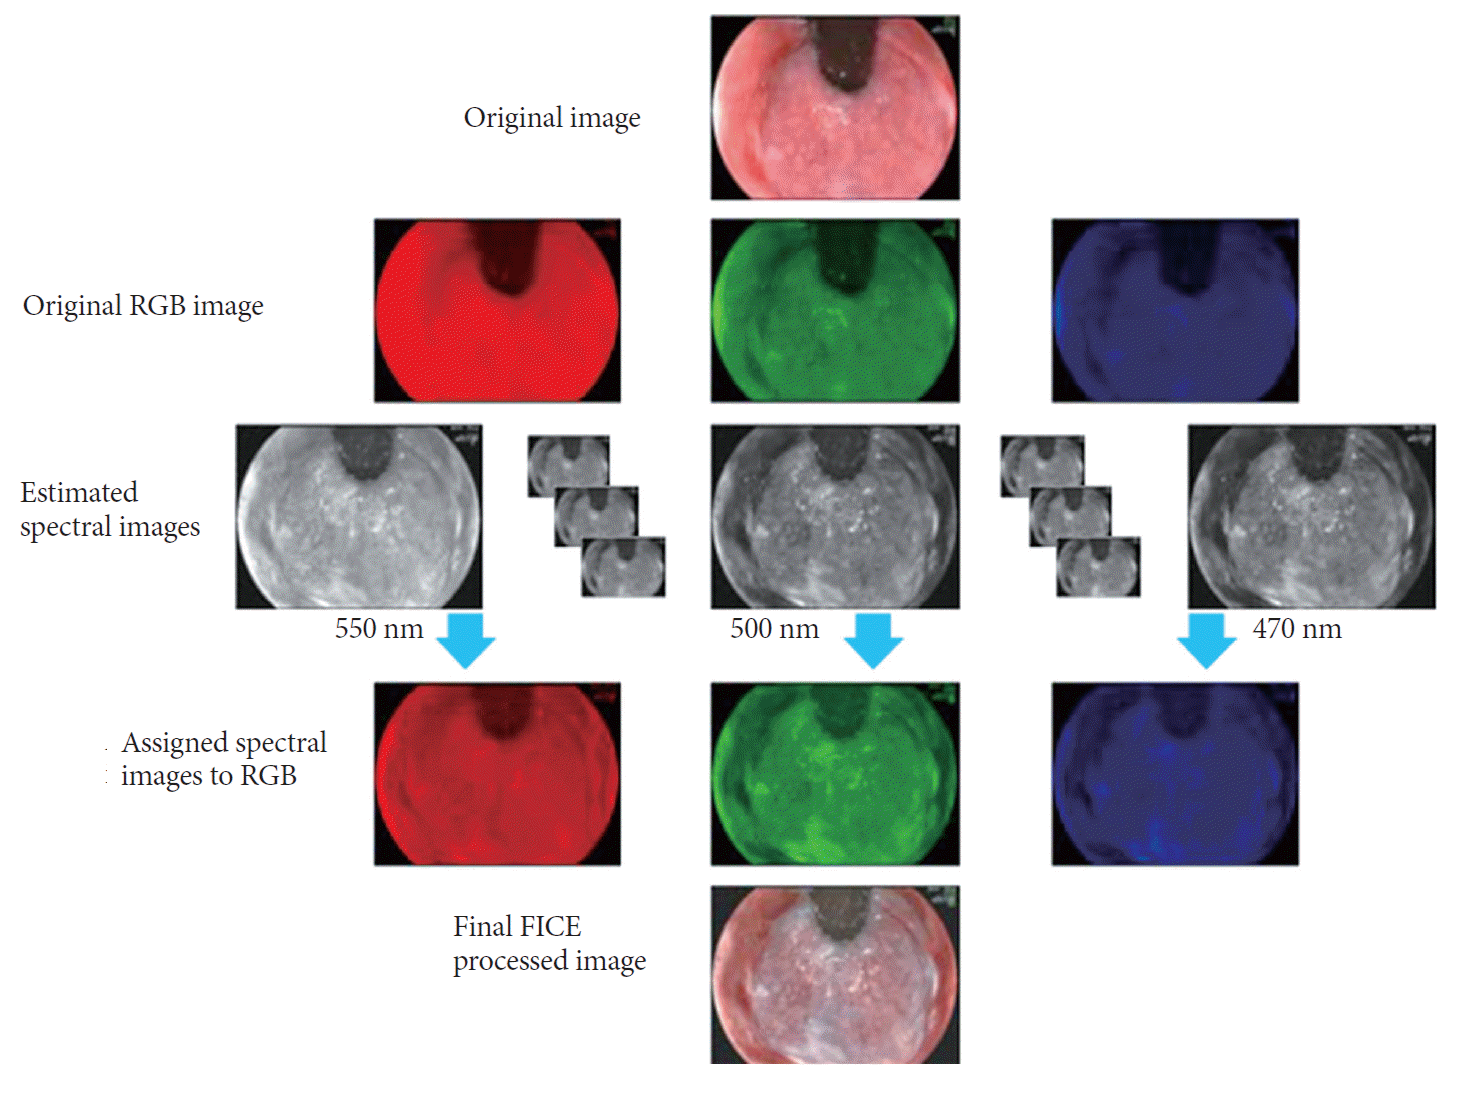
FICE, also known as multi-band imaging, is based on a spectral image processing technology. NBI uses physical filters, whereas the FICE system takes an ordinary endoscopic image from the video processor and arithmetically processes, estimates and produces an image of a given, dedicated wavelength of light (Fig. 6). By switching a button on the endoscope, the FICE system can select an optimal wavelength between 400 and 700 nm for various parts of the mucosa of the gastrointestinal tract. Single wavelength images are randomly selected, and assigned to red, green, and blue to build and display virtually enhanced color images.
Clinical applicability
For the diagnosis of BE, a total of 72 patients were enrolled into a comparative study using the WLE and FICE systems [36]. As a result, palisade vessels were more clearly observed in the BE mucosa with FICE than with WLE. The demarcation line between whitish BE mucosa and brownish gastric mucosa was more distinct on FICE images, thereby leading to an accurate diagnosis of BE.
When the extent of EGC was diagnosed, the FICE system was used to evaluate the demarcation lines between a depressed-type and an elevated-type EGC and the surrounding tissue [37-39]. Both expert and non-expert endoscopists determined tumor margins with higher accuracy compared to WLE. In a study by Jung et al. [40], FICE was also useful for the diagnosis gastric lesions such as non-neoplastic lesions, adenomas, and cancer.
In previous studies, FICE showed a reasonable accuracy for characterization of colorectal lesions but did not increase adenoma detection rate. In a prospective, randomized, back-to-back trial, there was no significant difference in the adenoma miss rate between FICE and WL colonoscopy (6.6% vs. 8.3%, p=0.59) [41]. When Chung et al. [42] performed screening colonoscopy in a total of 1,650 subjects, the diagnostic efficacies of NBI, FICE, and WL colonoscopy were compared. As a result, neither NBI nor FICE improved adenoma detection or miss rates, with no difference between the two systems. Regardless of experts or non-experts, the NBI and FICE system had no additional benefits over WL colonoscopy. A large, prospective study involving 763 subjects evaluated the histological prediction of small colon polyps by using FICE with magnification [43]. The overall accuracy of diagnostic rates of adenomas was <10 mm achieved by FICE with/without magnification were 87.0% and 80.4%, respectively (p<0.05). When colon polyps were less than 5 mm, there was more significant differences between magnification and non-magnification (85.4% vs. 79.1%, p<0.05). Compared to indigo carmine chromoendoscopy, adenoma detection rates were not enhanced by the FICE system (35.4% vs. 35.6%, p=1.0) [44]. For identifying adenomas, Pohl et al. [45] showed that the sensitivity and diagnostic accuracy rates using FICE were significantly higher than those of WLE and comparable to those of conventional chromoendoscopy.
OTHER IMAGING TECHNOLOGIES
Optical coherence tomography (OCT) is analogous to B-mode ultrasonography [46]. When an OCT probe is passed through the accessory channel of an endoscope, cross-sectional images of the target tissue with high resolution can be obtained. Because the penetration depth of OCT is about 1 to 2 mm, it has a potential to evaluate an underlying malignancy beneath the gastrointestinal mucosa. In several studies, OCT has been used to characterize in vivo histopathology and diagnose high-grade dysplasia in patients with BE [47]. A recent study showed that OCT could determine the presence of malignancy in biliary strictures [48].
Endocytoscopy is an ultra-high magnification technique that enables surface morphology and even subcellular level to be assessed in real time, with magnification in excess of 450-fold [49]. As a contrast agent, the topical application of methylene blue or crystal violet is used for the detailed visualization of target lesions. In Japanese studies, endocytoscopy enabled in vivo histopathological diagnoses of the esophagus, stomach, and colon. The diagnostic differentiation of neoplastic from non-neoplastic tissue was also achieved.
Recently, the blue laser imaging (BLI) system was developed for the detailed observation of vascular and mucosal surface pattern [50]. The BLI system has two laser sources of 410 and 450 nm. The strong laser with a 450 nm wavelength irradiates phosphor to produce illumination similar to that of a xenon lamp. In the BLI system, a 410 nm wavelength functions as a narrow band light. BLI light is provided in combination with 410- and 450-nm lasers, and fluorescent light. This novel system may be useful for detailed information of microstructure and microvasculature on the gastrointestinal mucosa. In Japan, Yoshida et al. [51,52] reported that the BLI system had a good diagnostic efficacy for histological classification and prediction of the invasion depth in colorectal tumors. Further large-scale investigations are required to prove these potential applications in clinical practice.
CONCLUSIONS
With recent advancement in endoscopic imaging technology, optical biopsy has enabled real-time histologic prediction of tumors. The improvement in endoscopic resolution can facilitate the determination of accurate and detailed endoscopic findings. Moreover, new imaging technologies may make endoscopists walk a big step in the field of diagnostic and therapeutic gastrointestinal endoscopy. In the future, further studies are needed to evaluate cost-effectiveness and diagnostic accuracy.
Notes
Conflicts of Interest: The author has no financial conflicts of interest.


