Increasing trend of endoscopic drainage utilization for the management of pancreatic pseudocyst: insights from a nationwide database
Article information

Abstract
Background/Aims
The pancreatic pseudocyst (PP) is a type of fluid collection that typically develops as a delayed complication of acute pancreatitis. Drainage is indicated for symptomatic patients and/or associated complications, such as infection and bleeding. Drainage modalities include percutaneous, endoscopic, laparoscopic, and open drainage. This study aimed to assess trends in the utilization of different drainage modalities for treating PP from 2016 to 2020. The trends in mortality, mean length of hospital stay, and mean hospitalization costs were also assessed.
Methods
The National Inpatient Sample database was used to obtain data. The variables were generated using International Classification of Diseases-10 diagnostic and procedural codes.
Results
Endoscopic drainage was the most commonly used drainage modality in 2018–2020, with an increasing trend over time (385 procedures in 2018 to 515 in 2020; p=0.003). This is associated with a decrease in the use of other drainage modalities. A decrease in the hospitalization cost for PP requiring drainage was also noted (29,318 United States dollar [USD] in 2016 to 18,087 USD in 2020, p<0.001).
Conclusions
Endoscopic drainage is becoming the most commonly used modality for the treatment of PP in hospitals located in the US. This new trend is associated with decreasing hospitalization costs.
INTRODUCTION
Pancreatic pseudocysts (PPs) are encapsulated peripancreatic fluid collection with well-defined inflammatory walls and minimal or no necrosis. They typically form four weeks after an episode of acute pancreatitis, contain amylase-rich fluid, have essentially no solid debris, and possess a well-defined, non-epithelialized wall.1 This occurs in approximately 7% of acute pancreatitis cases; moreover, PP can occur in 10% to 30% of chronic pancreatitis cases.2 PP can be complicated by bleeding, obstructive symptoms, or infection in 10% to 20% of cases, with an estimated mortality rate of 10%.2 Traditionally, PPs are treated by open surgical drainage; however, advancements in less invasive methods, such as endoscopy, laparoscopy, and percutaneous drainage, have resulted in a decline in the use of the open surgical approach. The most common drainage modality is cystogastrostomy, which can be performed laparoscopically or endoscopically. Our study analyzed trends in the utilization of percutaneous, endoscopic, laparoscopic, and open drainage modalities using a nationwide database.
METHODS
Data source
The National Inpatient Sample (NIS) database from 2016 to 2020 was used to obtain the data. The NIS is the largest all-payer healthcare database and accounts for approximately 97% of all hospitalizations in the US. It is produced by the Health Care Cost and Utilization Project and consists of a random sample accounting for 20% of all hospitalizations. Starting in the last quarter of 2015, the International Classification of Diseases, 10th Revision, Clinical Modification/Procedure Coding System (ICD-10-CM/PCS) was used instead of the ninth revision (ICD-9-CM/PCS). In addition to the ICD-10 codes, the NIS includes hospital-level information such as hospital bed size, location, and teaching status. Hospital teaching status is defined by the Health Care Cost and Utilization Project according to certain criteria, including approval of residency training by the Accreditation Council for Graduate Medical Education and the ratio of residents to beds.3 The bed size definition in the NIS varies according to the hospital region, location, and teaching status.3,4
Study population and outcome measures
The NIS database 2016–2020 was queried for all adult hospitalizations with a principal diagnosis of PP. The ICD-10 diagnostic code used for PP was K863. The trends were not analyzed in the years prior to 2016, as the ICD-10 code for PP was created in October 2015, and there was no dedicated diagnostic code for PP prior to that date. Patients who underwent percutaneous, endoscopic, laparoscopic, or open drainage procedures were identified based on the ICD-10 procedure codes used in prior studies (Table 1).5,6 Patients who did not undergo any drainage procedure were excluded. In addition, patients who underwent more than one drainage modality were excluded from the subgroup analysis to avoid confounding factors. Baseline patient and hospital characteristics of the study population were analyzed and compared among the four groups. Categorical variables are presented as percentages and linear variables are presented as mean±standard deviation. Trends in the utilization of different drainage modalities over the years were analyzed. Trends in mortality, length of stay, and cost of hospitalization in patients admitted with PP requiring drainage were also analyzed after adjusting for age and sex.
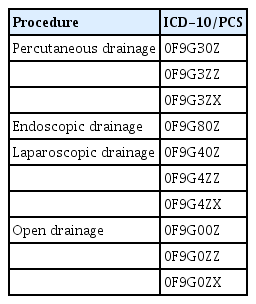
ICD-10 procedural codes
Statistical analysis
STATA software ver. 15 (StataCorp.) was used for statistical analysis. p-value ≤0.05 was considered statistically significant. Weighted estimates provided by the database were used as the database represents a 20% random sample of all hospitalizations across the United States. The chi-square test was used to compare categorical variables, and the Student t-test was used to compare linear variables. Multivariate logistic regression analysis was used to analyze trends.
Ethical statements
The study was exempted from review by the institutional review board because it utilized a limited dataset.
RESULTS
Baseline characteristics
We identified 23,760 patients admitted between 2016 and 2020 with a prinicipal diagnosis of PP. Of these, 6,330 underwent drainage of the pseudocyst via a single modality (Fig. 1). The mean age of the study population was 51 (±7) years. Male and female percentages were 60% and 40%, respectively. The majority of the study population was Caucasian (70%). Table 2 shows the baseline characteristics of the four drainage modalities groups. We found endoscopic and laparoscopic drainage to be more commonly utilized in teaching and large hospitals than percutaneous and open surgical drainage. In addition, there was a difference in the adaptation of the different drainage procedures across United States regions, with endoscopic drainage being the most commonly used procedure in the Midwest region. Percutaneous and open drainage are more commonly performed than endoscopic and laparoscopic drainage in the South region. In the West region, endoscopic drainage was the least commonly used procedure (Table 2).
A diagram showing the flow of patients included in the study. The flowchart demonstrates the inclusion criteria for the study. PP, pancreatic pseudocyst.
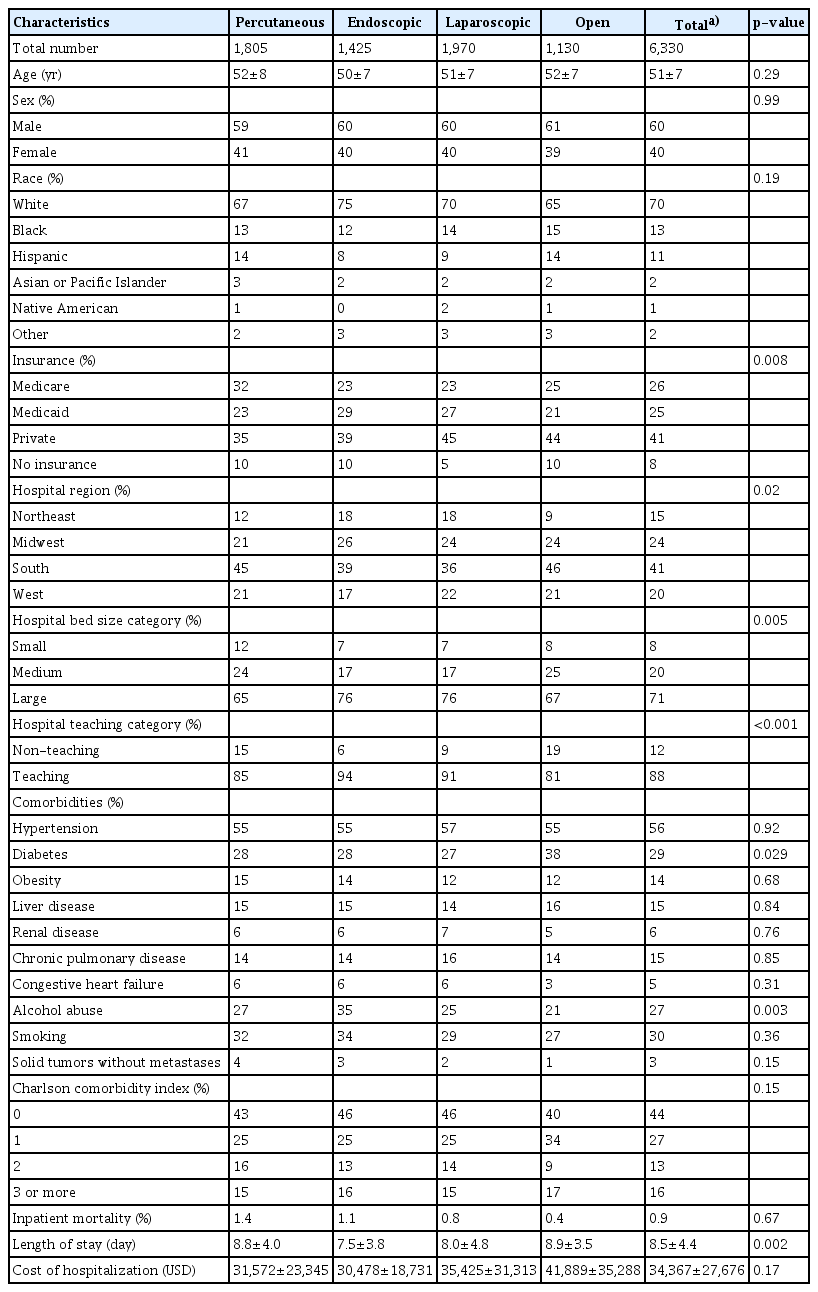
Baseline characteristics of the different pancreatic pseudocyst drainage groups
Trends of procedural utilization
Percutaneous, laparoscopic, and open drainage modalities were used in 28.5%, 31.1%, and 17.9% of hospitalizations, respectively, with a decreasing trend in the utilization of the three modalities. The p-values for the percutaneous, laparoscopic, and open drainage trends were <0.0001, <0.0001, and 0.0029, respectively. Endoscopic drainage was the most commonly performed procedure in the 2018–2020 period (41.0%), with an increasing trend over time. The number of endoscopic drainage procedures increased from 385 (33% of pseudocyst hospitalizations) in 2018 to 515 in 2020 (50%), with a p-value of 0.0033 (Table 3, Fig. 2). We could not estimate the volume of endoscopic drainage procedures performed before 2018, as the ICD-10 code for the procedure was developed at the end of 2017.
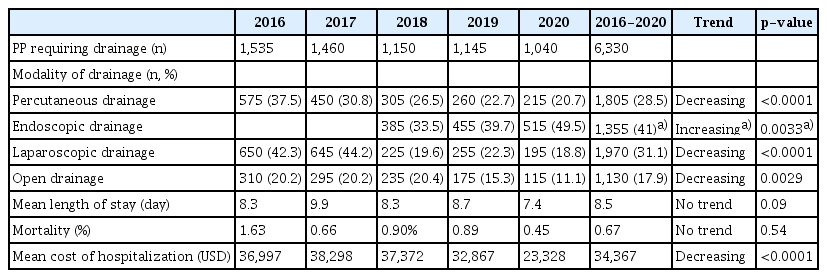
Trends of pancreatic pseudocyst requiring drainage from 2016–2020
Trends in utilization of the pancreatic pseudocyst drainage modalities. The run chart demonstrates the trends in the utilization of pancreatic pseudocyst drainage modalities over a 5-year period.
Clinical outcomes
The adjusted trends of mortality, length of stay, and cost of hospitalization for all PP requiring drainage, regardless of intervention type, were analyzed (Table 3). The mortality rate was 0.67%, with a fluctuating trend that was highest in 2016 and lowest in 2020 (p=0.537). The length of hospital stay varied over the years, with the shortest duration recorded in 2020 (p=0.001). A significant decline in the cost of hospitalization was noted from 36,997 United States dollar (USD) in 2016 to 23,328 USD in 2020 (p<0.0001) (Table 3). The endoscopic drainage cost of hospitalization was numerically lower than that of the other three modalities (Table 2), indicating that higher endoscopic utilization contributed to the decrease in hospitalization costs over the years.
DISCUSSION
PPs are caused by ductal disruption owing to increased ductal pressure within the pancreas. This can be due to stenosis, calculi, protein plugs in the main pancreatic ductal system, or necrosis from acute pancreatitis.7 PP drainage is indicated for symptomatic patients, cysts >6 cm in size, rapid growth, or associated complications, such as infection and bleeding.2,7 Poor predictors of resolution or complications of PPs are the size and length of time present. In addition, increased cyst size is associated with increased symptoms and complications.7
Surgical cystogastrostomy involves an open or laparoscopic approach to create a fistula between the lumen of the pseudocyst and the stomach or small bowel, whereas percutaneous drainage involves placing an external drain into the pseudocyst under the guidance of computed tomography or ultrasound with fluoroscopy. Using the endoscopic ultrasound in PP drainage allows endoscopists to identify and avoid vessels between the cyst and the gastric lumen and measure the distance between the enteral lumen and the PP to ensure proper drainage and stent placement.8,9
In a randomized trial comparing surgical and endoscopic cystogastrostomy, Varadarajulu et al.9 reported no differences in the rates of treatment success, treatment failures, complications, or re-interventions. Although not included in these studies, percutaneous drainage was associated with high recurrence rates.2 In their meta-analysis, Farias et al.2 reported 19 adverse events among 165 procedures (11.5%) performed endoscopically; whereas in the surgical group, there were 35 of 177 procedures (19.7%). Zhao et al.10 demonstrated no statistically significant differences in adverse events between endoscopic and surgical groups. Multiple studies have shown endoscopic drainage to have a shorter hospitalization stay and lower treatment cost compared to other modalities.1,2,9
The current study findings indicate that the primary difference between the four modalities is linked to the hospital rather than to patient characteristics, as shown in Table 2. With the exception of diabetes and alcohol intake, there were no significant differences in baseline patient characteristics and the Charlson comorbidity index between the four groups. In contrast, there was a notable trend towards greater utilization of endoscopic drainage in large and teaching hospitals, as well as a higher frequency of endoscopic drainage modalities in the Midwest and Northeast regions compared to other modalities.
Our study revealed a decrease in the number of percutaneous, open, and laparoscopic drainage procedures performed between 2016 and 2020. Considering the absence of designated ICD-10 codes for endoscopic drainage in 2016 and most of 2017, it is possible that these procedures were coded under different procedural codes, with a significant proportion coded under the laparoscopic procedural ICD-10 codes. This is supported by the significant drop in the volume of laparoscopic procedures between 2017 and 2018. Therefore, it is assumed that the data obtained in the last three years are more accurate in reflecting the proportion of patients undergoing each drainage procedure for PP. Nevertheless, a clear trend was observed towards greater utilization of endoscopic drainage with an overall gradual downtrend of other procedures from 2018 to 2020, supporting the observation that the change in the numbers reflects true changes in clinical practice with regard to the management of PP across the US hospitals. Moreover, the absolute number of endoscopic drainage procedures was significantly higher than that of other procedures between 2018–2020. It is expected that the rising trend of endoscopic drainage of PP will continue because of the expansion of interventional gastroenterology training programs and patient preference for the endoscopic treatment option because of its similar efficacy to the other treatment options, lower adverse event rates, lower hospitalization costs, and better quality of life outcomes.
Our study has several strengths. This is the largest retrospective cohort to describe the baseline characteristics and clinical outcomes of patients with PP requiring drainage, and the first to compare endoscopic drainage to more traditional modalities. Moreover, this is the first study to analyze the trends in the utilization of different drainage modalities for pseudocysts over time. The limitations of this study include the possibility of coding errors and bias, because the NIS is an administrative database consisting mainly of ICD-10 codes. In addition, owing to the limitations of the database, details related to the indications for drainage, cyst size, and drainage equipment could not be obtained. Additionally, our analysis included only patients with pseudocysts who underwent inpatient drainage because the NIS is an inpatient database.
Notes
Conflicts of Interest
The authors have no potential conflicts of interest.
Funding
None.
Author Contributions
Conceptualization: KE, MM, AB, SH; Methodology: KE, MM, SC, LDS, SN, HA, FJ; Supervision: SH, SN; Writing–original draft: KE, SC, LDS, MM, HA, SN, SH; Writing–review & editing: KE, MM, AB, FJ, SN, SH.