Endoscopic Ultrasound Elastography for the Pancreas in Korea: A Preliminary Single Center Study
Article information
Abstract
Background/Aims
Endoscopic ultrasound elastography (EUS-EG) has been widely used for the evaluation of pancreatic cancer in the Western world. To date, there is very little experience with EUS-EG in Korea. We described the results of comparison between normal pancreas and pancreatic cancer in Korea.
Methods
The present study was performed at a tertiary hospital on 35 subjects comprising 20 with normal pancreas (control group) and 15 with pancreatic cancer (disease group). We compared the EUS-EG performance of the two groups.
Results
The pancreas in the control group showed a mean elasticity value of 0.53% (95% confidence interval [CI], 0.45 to 0.61). The elasticity value was higher than that previously reported from Western country (0.47%; 95% CI, 0.38 to 0.57). In the disease group, the mean elasticity value of pancreatic lesions was 0.02% (95% CI, 0.01 to 0.02). The mean elasticity value of the disease group was significantly lower than that of the control group (p<0.0001).
Conclusions
EUS-EG could be a highly sensitive diagnostic modality for pancreatic cancer in Korea with little EUS-EG experience. We also provided the reference range of elasticity value of normal pancreas, which might be valuable in the interpretation of pancreatic elasticity data for Korean adults.
INTRODUCTION
Elastography is an imaging modality for the evaluation of tissue stiffness, and has been used in the analysis of superficial organs, including the breast and prostate.1,2 Tissue elasticity measurements have been reported to be useful for the diagnosis and differentiation of tumors, which are stiffer than normal tissues.3 The recent introduction of endoscopic ultrasound elastography (EUS-EG) allows quantitative analysis of tissue stiffness, and is a promising imaging technique with a high accuracy for the differential diagnosis of solid pancreatic tumors.4-9 In 20 patients with extrapancreatic disease, healthy pancreatic tissues were reported to show a mean elasticity value of 0.47% (95% confidence interval [CI], 0.38 to 0.57).10 A mass elasticity value of 0.05% or lower had a 100% sensitivity for classifying tumors correctly as malignant.10
To our knowledge, the recently developed EUS-EG is currently available in Korea; however, there are no EUS-EG studies on the pancreas in the Korea population. To date, there is very little experience with EUS-EG in Korea. There is also little knowledge about reference range of pancreatic elasticity value in healthy subjects, which might be different from that of Western people. In the present study, the performance of EUS-EG for normal pancreas and pancreatic cancer are reported from Korea with little experience of EUS-EG.
MATERIALS AND METHODS
Subjects
We retrospectively identified 320 subjects who underwent EUS-EG for the evaluation of extrapancreatic and pancreatic diseases in our hospital between March 2011 and March 2012.
Of these, 105 subjects who had undergone both computed tomography (CT) study and EUS-EG study for the pancreas were reviewed according to the aim of EUS-EG study. Eighty eight subjects underwent EUS-EG for the evaluation of extrapancreatic diseases. EUS-EG was performed in 17 subjects with pancreatic disease. Given the potential presence of pancreatic disease in those with extrapancreatic disease, the subjects were excluded if they did not meet one or more of the following criteria: 1) no history of pancreatic disease; 2) no symptom of dyspepsia; 3) no history of alcohol consumption; 4) no history of smoking; 5) normal serum amylase and lipase levels; 6) normal CA 19-9; 7) normal EUS findings of the pancreas; and 8) normal CT findings of the pancreas. Of those with pancreatic disease, two subjects were excluded because they had not pancreatic cancer but other pancreatic disease, such as acute pancreatitis or solid pseudopapillary neoplasm. Therefore, the control group included 20 subjects (11 males; mean age 61.3 years) and disease group included 15 (13 males; mean age 69.2 years). The flow chart and details of study participants are shown in Table 1, respectively.
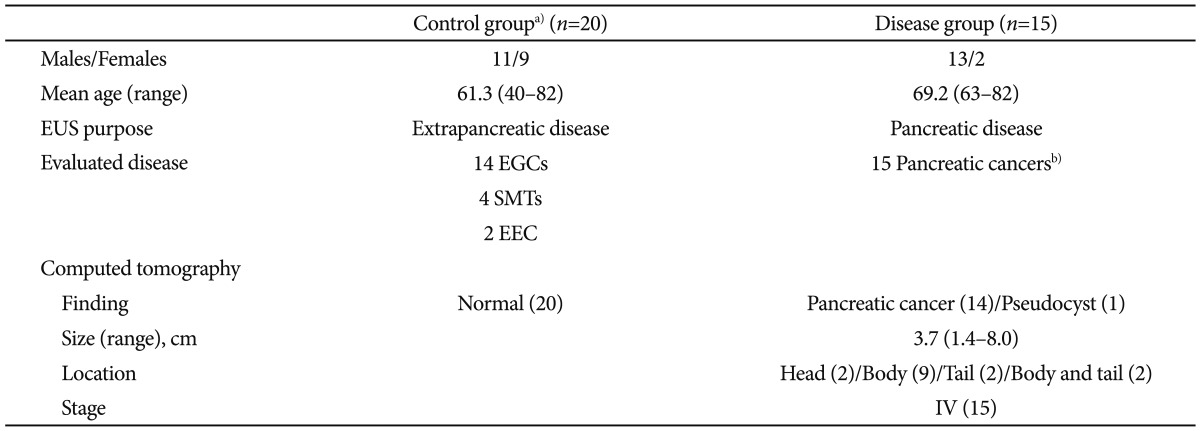
Details of 35 Subjects in the Present Study
Methods
The following data were prospectively collected for all patients: personal data, diagnosis at admission, clinical history, conventional EUS examination, EUS-EG, and final diagnosis. All endoscopic examinations were performed by one EUS endoscopist (T.H.L.). EUS was performed using EG-3670 URK electronic radial-type ultrasonographic endoscope (PENTAX Co., Ltd., Tokyo, Japan) and EUB-7500 ultrasound (Hitachi Co., Ltd., Tokyo, Japan), in which the real-time tissue elastography module and software were installed. This module enabled real-time elastographic evaluation and recording.
The technology is based on the detection of small structure deformations, within the B-mode image, caused by compression, making the elasticity value smaller in hard tissues than in soft tissues.1 The degree of deformation is used as an indicator of tissue stiffness.11
Different elasticity values are marked with different colors, resulting in varying elastographic patterns. These patterns are shown superposed on the conventional grayscale EUS image. The system displays a hue color map (red, green, blue), where hard tissue areas are shown in dark blue, medium-hard tissue areas in cyan, intermediate tissue areas in green, medium-soft tissue areas in yellow, and soft tissue areas in red.
Our EUS-EG protocol for obtaining the best reproducibility of image acquisition with comparatively few artifacts was achieved using the following parameters: 1) the probe was attached to the wall, and the examiner exerted the pressure needed for an optimal and stable B-mode image; 2) because elastography images tend to show rapidly changing colors, an image that was stable for at least 3 seconds was accepted; 3) elastographic images were accepted only when a compression grade of 3 to 4 was achieved; 4) a dynamic range setting of four provided a good display of the contrast between hard tissues (blue) and the surrounding normal tissues (green to red); and 5) the rejection function, affecting the threshold level for rejecting noisy regions within the entire frame, was set to one.
Qualitative analysis
One EUS endoscopist (T.H.L.) analyzed elastographic images in terms of dominant colors and their distribution. Elastographic colors were classified as 1) predominantly green color pattern (green, soft/intermediate stiffness) or 2) predominantly blue pattern (blue, hard tissue). Elastographic patterns of distribution were classified as 1) relatively homogeneous pattern (homogeneous colors) or 2) heterogeneous pattern (areas of two or more different colors). Elastographic images were qualitatively evaluated twice by the same examiner.
Quantitative analysis
In the control group, two areas (A and B) among the regions of interest (ROIs) were selected for quantitative analysis. Areas A and B are representatives of normal-appearing pancreatic parenchyma. To limit the selection bias of areas A and B, the elasticity values of the A and B areas were calculated in duplicate for each patient; the mean of the two measures was considered as the final elasticity value (Fig. 1). In the disease group, two different areas (A and B) were selected among the ROIs. Area A is representative of the pancreatic lesion and included the largest possible area of the lesion. Area B refers to a soft peripancreatic tissue or adjacent background pancreatic parenchyma. To limit selection bias of areas A and B, the elasticity values of areas A and B were calculated in triplicate for each patient. The mean of the three measures of area A was considered as the final elasticity value in the disease group (Fig. 2).
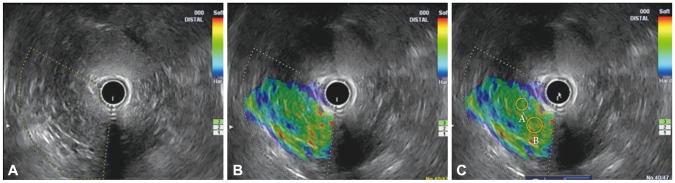
Elasticity measurements of the pancreas in the control group. (A) Normal-appearing pancreas on B-mode. (B) Green color with homogeneous distribution throughout the pancreatic parenchyma. (C) Two areas (A and B) were selected, among the regions of interest, for quantitative analysis.
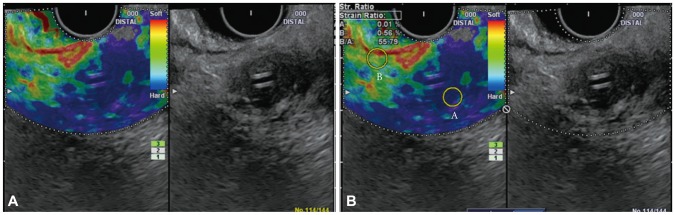
Elasticity measurements of pancreatic lesions in the disease group. (A) Dual views show the elastography mode (left panel) and B-mode (right panel). The area with green/heterogeneous pattern is representative of peripancreatic tissue, while the lesion with blue/heterogeneous pattern is representative of pancreatic cancer. (B) Area A was selected for quantitative analysis among the regions of interest.
Outcome measures
The elastographic colors and elastographic patterns of distribution were evaluated in the two groups. To calculate the intraobserver reproducibility, the concordance rate was measured using the agreement between the first and second interpretations with respect to the elastographic colors and elastographic patterns. The elasticity values were measured and compared between the pancreatic lesions of the disease group and the pancreas of the control group.
Statistical analysis
Data for the frequency and mean (with range) were presented in the text and tables when appropriate. Comparisons of the elastographic colors and patterns of distribution were performed using Fisher's exact test. The elasticity values were compared between the two groups using Mann-Whitney U-test. A p-value of less than 0.05 was considered statistically significant. Statistical analyses were performed using the software SPSS version 12.0 (SPSS Inc., Chicago, IL, USA).
RESULTS
Qualitative analysis
EUS examinations of the pancreas in the control group participants showed green color only, with homogeneous (nine patients, 45%) or heterogeneous (11 patients, 55%) patterns. Pancreatic lesions of the participants in the disease group showed blue color only, with homogeneous (two patients, 13.3%) or heterogeneous (13 patients, 86.7%) patterns. In the control group, the concordance rates of the elastographic color and pattern of distribution were 75% and 100%, respectively. Those from the disease group were 100% (Table 2).
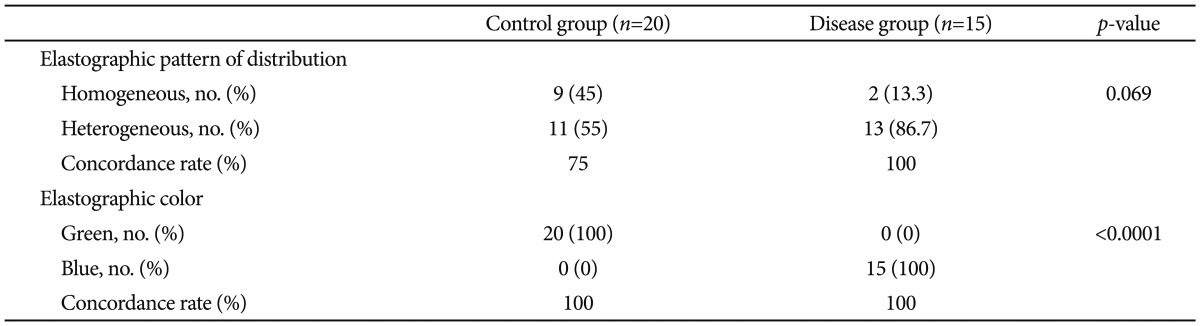
Qualitative Analysis of the Pancreas and Pancreatic Lesions
Quantitative analysis
The pancreas in the control group showed a mean elasticity value of 0.53% (95% CI, 0.45 to 0.61). In the disease group, the mean elasticity value of pancreatic lesions was 0.02% (95% CI, 0.01 to 0.02). The mean elasticity value of the disease group was significantly lower than that of the control group (p<0.001) (Fig. 3).
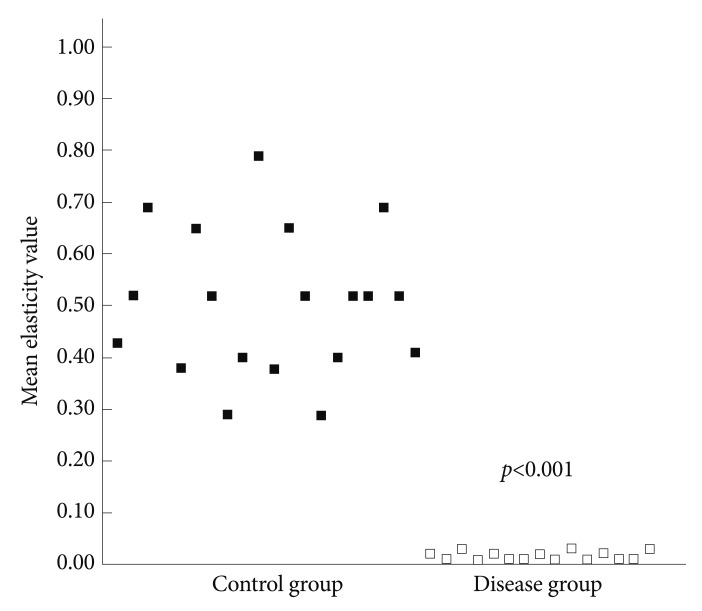
Comparison of mean elasticity values of the pancreas and pancreatic lesions between the control group and the disease group. The mean elasticity value of the disease group was significantly lower than that of the control group (p<0.001).
DISCUSSION
In the present study, for the first time, we described the performance of EUS-EG on the pancreas in Korean subjects with normal pancreas and pancreatic cancer. Although the sample size was relatively small, the present study provides evidence supporting EUS-EG as a useful tool for the evaluation of pancreatic cancer. The reference range of pancreatic elasticity value in the control group could be, to some extent, a representative of elasticity value in Korean normal pancreas.
The principle of EUS-EG is explained by using a spring model.12 Thus, when a one-dimensionally connected hard spring and soft spring are compressed together, the hard spring is deformed negligibly while the soft spring is compressed. This difference in deformation results in differences in displacement among areas, and the amount of distortion obtained by spatial differentiation of this displacement distribution provides elasticity information. Generally, tissue hardness is thought to correlate with malignant potential; malignant tumors are harder than benign ones.13 The elastic characteristics of the tissue appear to be fairly uniform and green throughout benign lesions. On the other hand, cancer grows in a muchunorganized way, which is why its elastic properties are rather heterogeneous and blue throughout the tumor lesion. On the basis of this concept, real tissue elastic imaging with EUS has been introduced for clinical use.12
Several recent studies have shown EUS-EG as a promising technique with a high accuracy for the differential diagnosis of solid pancreatic tumors.4-9 The features of the elastographic patterns, in the terms of homogeneity or heterogeneity and predominant color, are closely correlated with the histologic features of the lesion. In the first study published by Giovannini et al.,9 pancreatic masses appearing mostly blue were considered malignant, whereas other patterns were considered as benign. The authors reported that all malignant lesions were correctly identified by EUS-EG (100% sensitivity), and subsequent studies were triggered by these positive findings.
Elastographic imaging of the normal pancreas is characterized by a uniform, homogenous green color distribution (representing intermediate stiffness) throughout the organ, and the reproducibility of the signal is comparatively good.9 The predominant blue color with either a homogeneous or heterogeneous distribution pattern suggests the diagnosis of a malignant tumor. Interestingly, heterogeneous green color distribution was found in 11 (55%) subjects of the control group. The concordance rate between the first and second interpretations with respect to the elastographic patterns was 75%. These findings suggest that a potential limitation to EUS-EG is the subjective interpretation of the elastographic pattern, which decreases the accuracy of the test for evaluating pancreatic disease. The diagnostic sensitivity of qualitative EUS-EG for differentiation of solid pancreatic lesions has been reported to range from 41% to 100%,4-9 and the diagnostic specificity has been reported to range from 53% to 85.5%.4-9 These wide ranges of diagnostic sensitivity and specificity can result from subjective analyses of the elastographic patterns.
A potential limitation to EUS-EG is the degree of fibrosis that may be present in inflammatory tissue, making the tissue firm and thereby decreasing the accuracy of the test for diagnosing malignancy.14 Many studies supported the superiority of EUS compared to other imaging modalities, especially when dealing with small tumors (e.g., <2 to 3 cm).15,16
Given together, EUS-EG may be superior to other imaging studies for detecting cancer, although there is no direct comparison study between EUS-EG and other radiologic imaging examinations such as CT or magnetic resonance imaging (MRI).
The main pitfall of EUS-EG is represented by the impossibility to control tissue compression by the EUS transducer.8,12 The use of EUS-EG is also hampered by the motion artifacts, arising from respiratory or heart movements, which cannot be adequately eliminated or quantified. The presence of nearby structures with very low or high density and stiffness, such as heart, major vessels or spine, is also difficult to be excluded from the analyzed ROI. When selecting ROI, care should be taken to include only the surrounding soft tissues, since the methodology of elastography assumes computations relative to the average strain inside the ROI. The qualitative pattern analysis of the EUS-EG still images may be also associated with significant intra and interobserver variabilities. Adequate and reproducible elastographic imaging of focal pancreatic disease is confined to lesions less than 30 mm in diameter. In larger lesions, elastographic delineation was incomplete.
In the present study, EUS-EG described two cases with homogeneous pattern. Both of them had pancreatic body masses of small size (<3 cm). EUS showed that small pancreatic adenocarcinoma (<2 cm) were more homogeneously hypoechoic. EUS-EG may likewise reveal that small pancreatic cancer is less heterogeneous with blue mass. In fact, the first EUS-EG evaluation (during the examination) revealed a blue mass with homogeneous patterns, but the second EUS-EG evaluation by the same examiner (after the examination) showed rather heterogeneous patterns. These findings suggest that intrinsic limitations of EUS-EG are represented by low reproducibility and subjective interpretation, especially in larger lesions.
We applied strict inclusion criteria for the control group to determine the mean elasticity value of the normal pancreas in Koreans. It was noted that the elasticity value of Korean adults (0.53%; 95% CI, 0.45 to 0.61) was higher than that from Western country (0.47%; 95% CI, 0.38 to 0.57). The reason of this difference is not known, but it might be related to the differences of their race, gender or age. Our reference range of the elasticity value from the present study will be valuable in the interpretation of pancreatic elasticity data for Korean adults.
In our study, EUS-EG was helpful in the diagnosis of pancreatic cancer in a patient with chronic alcoholic pancreatitis. The 71-year-old patient, with a history of heavy alcoholism, was presented with upper abdominal pain. Abdomen CT was carried out and a diagnosis of chronic pancreatitis with pseudocyst was made. Further MRI revealed undetermined masses of pancreatic body. Findings of EUS-EG, for differential diagnosis, revealed heterogeneous, blue mass with a mean elasticity of 0.01%. And then, EUS-fine needle aspiration revealed a pancreatic adenocarcinoma. The case suggested that EUS-EG would be an efficient method to solve the problems of differential diagnosis of undetermined pancreatic masses on CT.
In conclusion, the present study indicated that EUS-EG could be a highly sensitive diagnostic modality for pancreatic cancer even in Korea with little EUS-EG experience. Furthermore, we provided the reference range of elasticity value of normal pancreas, which might be useful in the assessment of pancreatic diseases in Korean adults. These results warrant further confirmation in larger prospective studies in Korea.
Notes
The authors have no financial conflicts of interest.