Endoscopic Characteristics of Rugal Hyperplasia and Related Acid Condition in Helicobacter pylori-Infected Stomach
Article information

Abstract
Background/Aims
Rugal hyperplastic gastritis (RHG) is associated with Lauren’s diffuse-type gastric cancer (GC) and the accompanying active inflammation is linked to gastric hypoacidity. We tried to establish the steps for identifying high-risk GC patients.
Methods
We included 196 patients with confirmed Helicobacter pylori infection by rapid urease test during screening endoscopy for health check-up from January 2016 to September 2016; all patients underwent blood tests for pepsinogen I and II and fasting serum gastrin. We compared RHG findings with various other endoscopic mucosal images. We also evaluated the relationships between RHG and other mucosal aspects for a given acid status based on serological markers.
Results
Hypoacid and ultra-low-acid (67%) statuses were dominant, with only 18% hyperacid patients. RHG with high acid was related to a less atrophic body type (p=0.001), and RHG with ultra-low acid was associated with body xanthoma (p=0.029) and increased serum gastrin level (p=0.038). However, RHG’s influence on gastric acidity was only seen in closed-type endoscopic atrophic border (EAB), not in open type (p=0.001).
Conclusions
The majority of RHG patients had hypoacid status. RHG frequency showed no difference between closed and opentype EAB, but gastric acidity was influenced by RHG only in closed-type EAB.
INTRODUCTION
Rugal hyperplastic gastritis (RHG) is a gastric body fold width of over 5 mm, identified on inflating the stomach with an adequate amount of air during endoscopic examination [1]. This change in the stomach could be caused by various conditions, for example, infiltrative diseases such as lymphoma, eosinophilic infiltration, amyloidosis, and infectious conditions like tuberculosis or Helicobacter pylori infection [2,3]. In H. pylori-infected stomach, active inflammation and low acidity have been reported as the major contributing factors of gastric cancer (GC), especially the diffuse type in Lauren’s classification is frequent in the non-atrophic stomach with active inflammation [4-6]. RHG in H. pylori-infected stomach consists of mucosal hyperplasia and epithelial proliferation without glandular proliferation that leads to an increase in the foveolar–glandular thickness ratio, caused by an increase in the level of inflammation-induced cytokines, such as hepatocyte growth factor and interleukin 1-β [7]. Increased levels of inflammatory cytokines were correlated with increased inflammatory cells and showed a close relationship with increased mutagenicity via an increase in the level of 8-hydroxydeoxyguanosine (8-OHdG) (a marker of oxidative DNA damage) in enlarged fold gastritis [8]. Eradication of H. pylori showed improvement in fold thickness with complete disappearance of the neutrophils, which implies a close bond between the enlarged fold and neutrophils [9]. In H. pylori-infected gastric epithelium, there is a characteristic neutrophilic proliferative zone foveolitis without regard to any gastritis state (even in atrophic or metaplastic gastritis), and this could lead to glandular stem cell changes generating atypical malgun cells that can lead to gastric carcinogenesis; thus, increased inflammatory cell infiltration especially by neutrophils could be strongly associated with gastric carcinogenesis [4]. Further, increased inflammation would lead to depletion of gastric acid that could in turn lead to easy corpus migration of H. pylori, resulting in persistent corpus-dominant (based on gastritis activity) gastritis, which could contribute to gastric carcinogenesis even after patients with RHG manage to circumvent the emergence of diffuse-type gastric cancer (DGC) [10-12]. Considering these findings, it would be beneficial to shed light on the endoscopic characteristics of RHG concerning gastric acid.
Pepsinogen I (PG I) was correlated with gastric parietal cell mass and gastric acid output, but in H. pylori-infected stomach, PG I level was also influenced by mucosal inflammation, leading to a weak association between PG I and gastric acid [13,14]; therefore, PG I level as a marker of gastric acid secretion could have limitation in the acute secretory phase of H. pylori-infected stomach. PG II is a surrogate marker of active inflammation of gastric corpus in H. pylori-infected stomach [15], thus PG I level in this situation could be offset by the elevated amount of inflammation-related PG II to obtain the genuine amount of acid-related PG I in the relatively acute and secretory phase in the H. pylori-infected stomach. Many reports revealed different levels of PG I, II, and I:II ratio in gastric pathology. However, Iijima et al. showed that PG I:II ratio was a useful parameter for gastric acid secretion in H. pylori-infected stomach; the mean standard deviation (SD) of the endoscopic gastrin test (EGT) values in healthy patients without H. pylori infection was 3.6 (1.5) mEq/10 min, and they defined hypochlorhydria as an EGT value lower than mean (−1 SD), profound hypochlorhydria as an EGT value lower than mean (−2 SD), and hyperchlorhydria as an EGT value higher than mean (1 SD) [16]. Eventually, they revealed cutoff points of serological markers corresponding to each gastric acid status: hypochlorhydria was PG I:II ≤2.7, profound hypochlorhydria was PG I:II ≤2.2, and hyperchlorhydria was PG I:II ≥3.3 [16]; our cutoff for gastric acidity were based on this report. The recently developed Kyoto classification of gastritis classified the H. pylori-associated endoscopic findings responsible for gastric carcinogenesis and prepared scoring systems to evaluate the risk of GC, in which RHG plays a role with other endoscopic features in the identification of high-risk patients [17]. Because RHG is just one of the various features of H. pylori-infected gastric mucosa, RHG could be related to various intra-gastric statuses such as acid level, infection-duration, or severity of inflammation. In this study, we tried to elucidate the characteristics of RHG in H. pylori-infected stomach by observing the correlations among other endoscopic features and to find how RHG was connected to gastric acidity, as assessed by the PG test. Korea is the only country in the world that has adopted endoscopy as a method of GC screening. Thus, identifying high-risk patients on endoscopic exam should be a priority.
MATERIALS AND METHODS
Patient sample
From January 2016 to September 2016, we consecutively recruited 242 asymptomatic patients, who showed gastritis on endoscopy as part of a health check-up and gave their consent for H. pylori and PG tests for GC screening in addition to the check-up program offered by their local companies in Ulsan, Korea. Firstly, we included patients with confirmed H. pylori infection by rapid urease test, but we excluded those with a history of H. pylori eradication, those taking medicine influencing the appearance of the gastric mucosa (any acid-suppressive medicine or non-steroidal anti-inflammatory agent) within 8 weeks before examination (14 patients), and those with any past or on-going medical illness like liver or heart problem or malignant diseases (six patients). Secondly, since only visual images of the gastric mucosa were being examined, we excluded patients with no discernible endoscopic atrophic border (EAB) despite the positive H. pylori test (16 patients), which meant all our patients had definite endoscopic gastric atrophy. We also excluded patients who had organic gastrointestinal problems such as peptic ulcer diseases or malignancies (duodenal ulcer, three patients; gastric ulcer seven patients); in all, 196 patients were eligible for the study.
Endoscopic examinations
The patients were examined with conventional white-light endoscopy using a GIF-Q150 (Olympus Co., Tokyo, Japan), and endoscopic mucosal images were collected for each individual; the diagnosis of endoscopic gastritis was based on the studies of Nomura et al. and Cho et al. [18,19]. Rugal hyperplasia was defined as a gastric fold width of ≥5 mm, with the aid of opening width (7 mm) of biopsy forceps, despite sufficient inflation of the stomach. Each endoscopic parameter such as closed- or open-type EAB, body type, antrum visible vessel break etc. are described in Table 1. Representative images are shown in Figs. 1 and 2. All endoscopic procedures were performed by the main author to avoid inter-observer variability. We used Campylobacter-like organism (CLO) Helicobacter-detection kits (Asan Pharm Co., Ltd., Seoul, Korea), and the sample for the CLO test was taken from the low body greater curvature side of the stomach. This study was approved by the Korea National Institute for Bioethics Policy (KoNIBP).
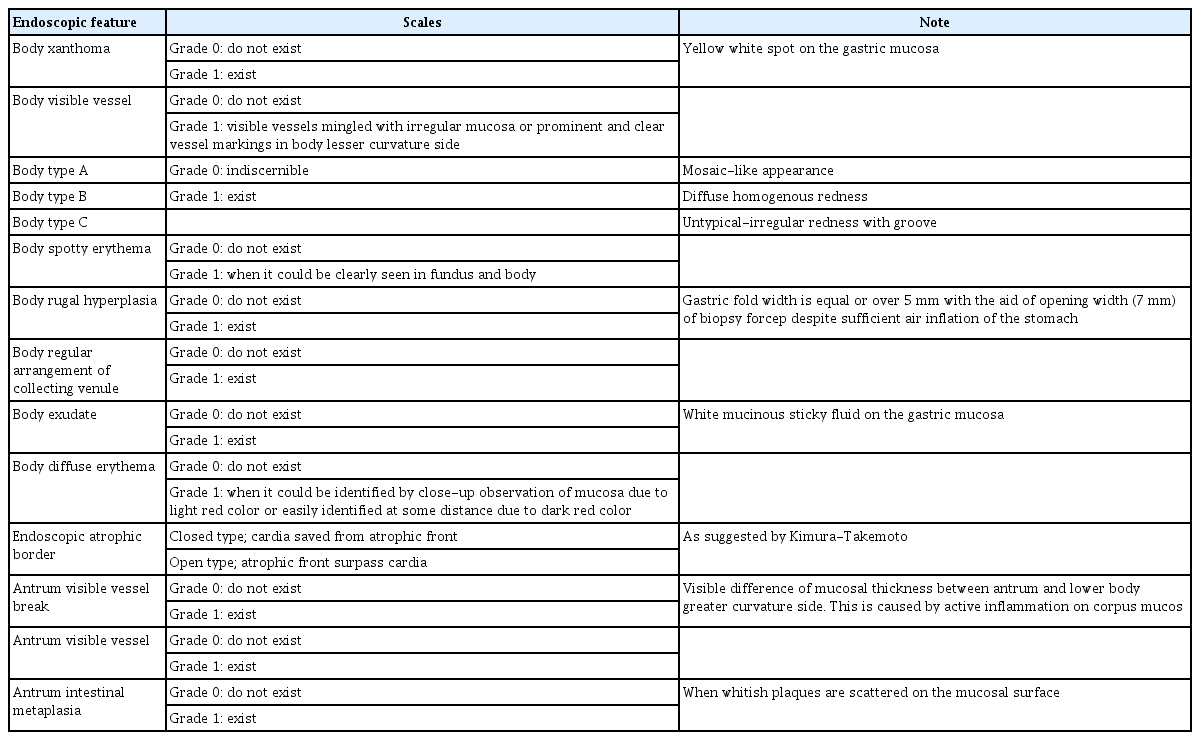
Endoscopic Parameters
Representative mucosal findings. (A-1) Normal body and (A-2) proximal antrum lesser curvature side; regular arrangement of collecting venule could be seen. (B) Antrum intestinal metaplasia—small, elevated white plaques are scattered on the antrum. (C-1) Antrum visible vessel—visible vessels can be seen without discernible changes in mucosal color and thickness in corpus greater curvature side. (C-2) Antrum visible vessel break—visible mucosal differences in thickness and color between antrum and lower body greater curvature side. (D-1) Body rugal hyperplastic gastritis, i.e., when gastric fold width is equal or over 5 mm with the aid of opening width (7 mm) of biopsy forceps despite sufficient aeration. (D-2) Rugal folds are prominent in spite of full aeration of stomach. (E) Body exudate—white mucinous fluid sticking to the mucosa. (F) Body spotty erythema—multiple, spotty, small erythema in the fundus and body area. (G) Body visible vessel—clearly visible vessel markings on lesser curvature of body. (H) Body xanthoma—yellow/white spots on the body. (I) Body-diffuse erythema—uniformly expanded mucosal erythema. (J) Body type A—mosaic-like appearance. (K) Body type B—diffuse homogenous redness. (L) Body type C—atypical pattern.

Representative mucosal findings of rugal hyperplastic gastritis (RHG). (A) Closed-type 2 RHG—atrophic front line (white line in A-1) is depicted below the half of the lesser curvature; (B) closed-type 3 RHG—atrophic front line is depicted above the half of the lesser curvature saving cardia (white line in B-1); (C) open-type 1 RHG—mucosal atrophy is visible around cardia area (C-1) and atrophic border reaches to upper part of anterior wall of body (C-2); (D) open-type 2 RHG—atrophic changes are present on the body area (D-1) and atrophic front occupies body anterior wall side (D-2); (E) open-type 3—atrophic changes are present on the body greater curvature area (E-1) and hypertrophied rugae, visible during inflation of the stomach (E-2).
Serum pepsinogen and gastrin levels
Fasting blood samples for serum PG and gastrin tests were collected before each endoscopy session, and the samples were centrifuged immediately at 4℃. Serum concentrations of PG I and II were measured by a latex-enhanced turbidimetric immunoassay (HBI Co., Anyang, Korea), and the PG I:II ratio was calculated. Each centrifuged serum sample for gastrin was stored at −20℃ until further assay and was measured using the GASTRIN [125I] Radioimmunoassay Kit (MP Biomedicals Korea, Seoul, Korea). Gastric acid status was classified as follows: PG I:II ratio ≤2.7 for hypoacid, >2.7 or <3.3 for normoacid, ≥3.3 for hyperacid, ≤2.2 for ultra-low-acid (or ultrahypoacid) status [16].
Data analysis
All the endoscopic characteristics were graded using scores (Table 1). To compare changes in serological markers depending on the progression of gastric atrophy (represented by EAB) between RHG-positive (RHG [+]) and RHG-negative (RHG [−]) patients, we performed simple regression analyses. Because the sample size of each endoscopic parameter or acid status for RHG was small (Tables 2-5), we performed Mann−Whitney U-test to evaluate the significance of each endoscopic appearance or each acid status according to the existence of RHG. P-value <0.05 was considered statistically significant. We used the SPSS ver. 18.0 for Windows Software (SPSS Inc., Chicago, IL, USA).

Characteristics of Subjects, Endoscopic Findings and Statistical Values
Influence of Rugal Hyperplastic Gastritis on Acidity depending on Endoscopic Atrophic Border: Closed Type Endoscopic Atrophic Border

Influence of Rugal Hyperplastic Gastritis on Acidity depending on Endoscopic Atrophic Border: Open Type Endoscopic Atrophic Border
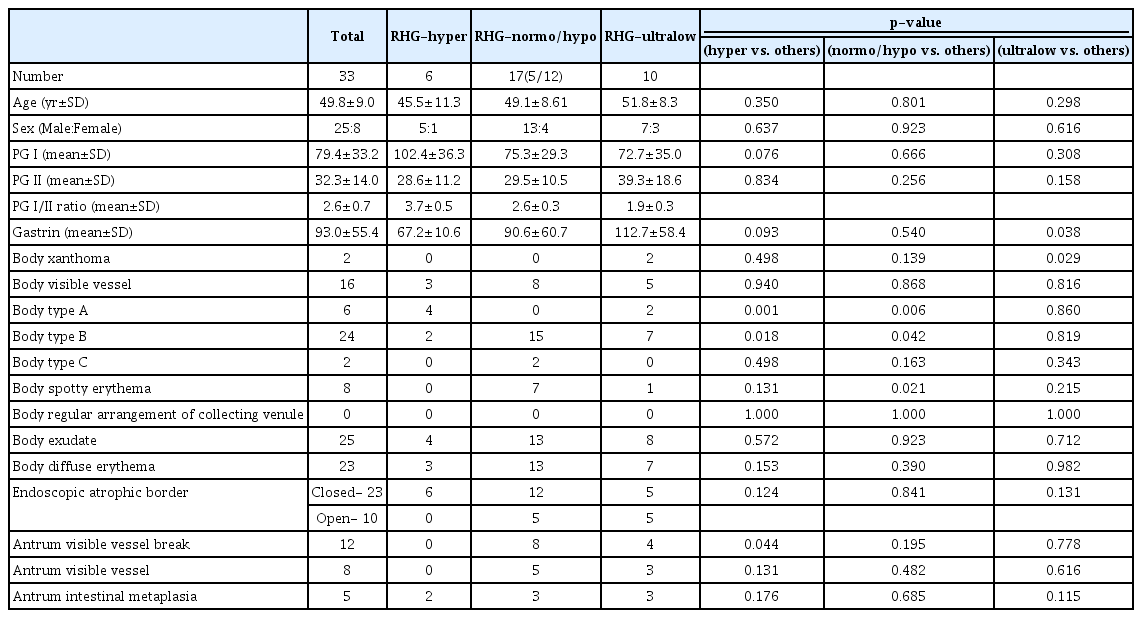
Characteristics of Subjects, Endoscopic Findings and Statistical Values between Acid Status in Subjects with Rugal Hyperplastic Gastritis
RESULTS
Characteristics of the patients, serological gastric markers, and endoscopic parameters
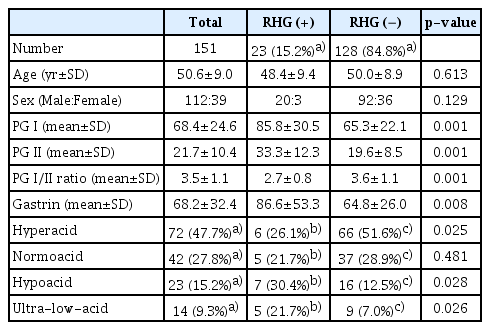
Out of 196 patients, 144 were males; the mean age was 50.6±9.0 years (mean±SD). Thirty-three patients were found to have RHG, accounting for 19% of all enrolled patients. Frequencies of mucosal appearances, mean ages, and sex ratios with SD of RHG (+) and RHG (−) patients are shown in Table 2.
Association between endoscopic parameters, serological gastric markers, and patients
In comparison to RHG (−) patients, RHG ( +) patients showed increasing levels of PG I (p=0.006), PG II (p=0.001), and gastrin (p=0.001), body type B (p=0.001), body exudate (p=0.001), body-diffuse erythema (p=0.022), and antrum visible vessel break (p=0.022). On the contrary, RHG ( +) patients were negatively related to PG I:II ratio (p=0.001), body type A (p=0.034), and regular arrangement of collecting venule (RAC) (p=0.03) (Table 2). The frequency of RHG (+) status was not significantly different between patients with closed and open-type EAB (15.2% of the total 151 closed-type vs. 22.2% of total 45 open-type) (p=0.273) (Table 2).
RHG (+) and (−) patients showed different patterns of serological markers depending on progression of atrophy on endoscopic findings. RHG (−) status showed a negative relation with PG I (p=0.002, r2-0.059), positive relation with gastrin (p<0.001, r2-0.064), no relation with PG II (p=0.054), and negative relation with PG I:II (p<0.001, r2-0.216). RHG (+) status did not reveal statistically significant relation with PG I (p=0.228), gastrin (p=0.221), PG II (p=0.802), and PG I:II (p=0.103) (Fig. 3).

Changes in serological markers depending on progression of endoscopic atrophic border (EAB) between rugal hyperplastic gastritis (RHG) (+) and RHG (−). Pepsinogen (PG) I, PG I:II, and gastrin levels in only RHG (−) patients showed statistically significant relation with progression of endoscopic atrophy. The number of X axis indicate progression of EAB. 1~3 corresponding to closed type EAB 1~3, 4~6 corresponding to open type EAB 1~3.
Association between serologically determined gastric acidity and rugal hyperplastic gastritis status
We divided our patients into four groups based on the PG I:II ratio, namely hyperacid, normoacid, hypoacid, and ultra-low-acid (Table 6). Our results showed that in RHG (+) patients, hypoacid and ultra-low-acid ratios were dominant (number of patients in both groups = 22, 67% of all RHG [+] cases). However, except for the normoacid group, acidity was influenced by RHG (+) status only in closed-type EAB, not in open type (p=0.001 for PG I:II ratio [Table 3] vs. p=0.353 for PG I:II ratio [Table 4]); the frequency of hyperacid was higher in RHG (−) closed-type EAB than in RHG (+) closed-type EAB (p=0.025); the frequency of hypoacid (p=0.028) and ultra-low-acid was higher in RHG (+) closed-type than RHG (−) closed-type EAB (p=0.026) (Tables 3, 4). Additionally, we focused on special situations of RHG (+) status accompanied with hyperacid or ultra-low-acid condition, so we subdivided the RHG (+) patients into three groups: hyperacid, normo/hypoacid, and ultra-low-acid groups (Table 5). On comparing the RHG-hyperacid group with the other RHG patients, we found body type A was positively associated with RHG-hyperacid (p=0.001) and negatively associated with RHG-normo/ hypoacid (p=0.006) conditions; the antrum visible vessel break tended to be associated with non-hyperacidity (p=0.044) (Table 5). When RHG was accompanied by type B, it was associated with normo/hypoacid (p=0.042) condition rather than hyperacidic condition (p=0.018), and body spotty erythema was associated with normo/hypoacid (p=0.021) condition (Table 5). Body xanthoma (p=0.029) and increased serum gastrin level (p=0.038) were more strongly associated with RHG (+)-ultra-low-acid condition than with other RHG groups (Table 5).
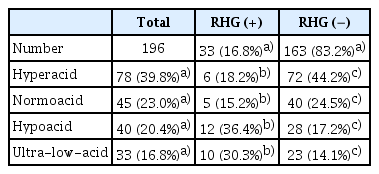
Acid Status of Rugal Hyperplastic Gastritis (+) and Rugal Hyperplastic Gastritis (−) Subjects
DISCUSSION
RHG is an acute-phase component of H. pylori infection of the stomach [20]; however, in one study involving middle-aged patients with RHG (35–59 years) [9], RHG was reported even beyond the acute phase of H. pylori infection in conjunction with advanced mucosal atrophy; thus, RHG might co-occur with advanced gastric atrophy.
The prevalence rates of RHG vary in different studies. In a study involving children, 47% of the 15 H. pylori-infected children had RHG [21]. Nishibayashi et al. found 81% of RHG cases in 135 early gastric cancer patients [8]; a barium-contrast-based study showed 67% of RHG prevalence in 1,702 patients with moderate atrophy (atrophy extended to corpus) [22], and in a report based on barium study as a part of mass screening for GC, the RHG prevalence was 15% [23]. Our study showed a prevalence rate of 19% in 196 patients, probably because of the considerable differences in the study patients, given the individual variability in inflammatory response to H. pylori. In contrast to the gastric antrum where grades of inflammation were linearly correlated with H. pylori density, there were individual differences in the inflammation severity depending on H. pylori density in the gastric corpus [24], and low density of H. pylori was noted in the gastric corpus even with severe atrophy [25]. Thus, we can expect different RHG prevalence rates among different patients. Furthermore, the formation of RHG is possible even in atrophic conditions if a given population has a strong inflammatory response to H. pylori and viable H. pylori in the atrophic stomach.
Korean patients have the highest risk of GC in cases of atrophic gastritis with H. pylori, while Japanese patients have the highest risk of GC in cases of atrophy without H. pylori; in Korea, GC patients are younger, with higher prevalence of DGC, than in Japan [26]. Therefore, considering the correlation of DGC with RHG [4,6] and of RHG with active inflammation [7,8], we can suggest that in Korean patients, H. pylori-associated active inflammation leading to RHG formation is frequent even in advanced atrophy cases.
In our report, RHG was associated with endoscopic mucosal appearances featuring active inflammation (body diffuse erythema, body exudate, antrum visible vessel break) and atrophic mucosa (body type B) [19], but negatively related to low atrophic condition (body type A) [19] or normal mucosa (RAC). These associations indicate that hypoacidity was dominant in our patient sample. This finding is comparable to that of a previous study which showed that highly active inflammation was correlated with decreased gastric acid [10] and of another study which showed dominant hypoacidity—10 hyperacid and 28 hypoacid patients out of 38 patients with enlarged gastric folds [27]. Therefore, we were aware that the major acid status in RHG patients would be low acid condition.
H. pylori-associated gastric acid change could be determined by the severity of inflammation depending on the distribution and density of H. pylori [10,11]. Antrum colonization led to normo or hyperacid condition, and corpus colonization led to parietal cell dysfunction, resulting in acid depletion [24,28,29]. However, the severity of inflammation caused by H. pylori showed individual differences in the corpus [25], and this contributed to acid reduction [10,24,29]. Considering these different inflammatory responses to H. pylori and dominant hypoacidity, it is reasonable to think that our RHG patients had a strong inflammatory response to H. pylori in the corpus, associated with active mucosal inflammatory features as in body spotty erythema and atrophic mucosa features as in body type B (Table 5). However, some of the patients without any other gastritis mucosal features but with a low degree of atrophic mucosa, as in body type A, showed hyperacid environment (Table 5).
Yasunaga et al. [23] showed acid recovery to the normal level of basal and maximal acid output after H. pylori eradication in RHG patients; additionally, they found that severe RHG (widest fold >10 mm) was only correlated with increasing level of gastrin. This suggests our ultra-low acid RHG patients might have folds sized over 10 mm (Table 5). Body xanthoma, featuring high-grade gastric atrophy [30], could be naturally associated with severe acid decrement as in our ultra-low acid group. Therefore, we could expect severe acid depletion resulting in elevation of serum gastrin, when encountering RHG with body xanthoma.
The clinical significance of RHG could change depending on the patients; for example, in elderly patients, RHG seems to be less influential in carcinogenesis than atrophy or intestinal metaplasia [31], but in younger patients, RHG showed a correlation with GC, especially DGC [6,8]. Our study showed that in RHG (−) patients, PG I and I:II ratio showed negative correlations with advancement of endoscopic atrophy, but PG I, II, and I:II ratio were not correlated with the progression of EAB in RHG ( +) patients. We found that the influence of RHG on gastric acidity was only limited to the closed-type atrophic stomach. Therefore, acid secretion inhibition by highly active inflammation occurs in the early stage of H. pylori infection of the stomach with substantial viable mucosa (Fig. 4). Our findings suggest that long acid depletion time starting from the non-atrophic period could be associated with future carcinogenesis in patients who barely escape the risk of DGC in younger age without advanced EAB.

Graph of serologically assessed acid changes in rugal hyperplastic gastritis (RHG) (+) and RHG (−) patients. In RHG (−) patients, gastric acid levels decrease depending on the progression of endoscopic atrophy. However, in RHG (+) patients, no relation with the progression of endoscopic atrophic border (EAB) was noted, and acid difference was only confined to closed-type EAB (lower acid levels in RHG [+] than in RHG [−] patients).
To summarize, firstly, the main acid status of RHG was hypoacidity and RHG’s influence on gastric acidity was limited to closed-type EAB, indicating the occurrence of hypoacidity even in the early stage of H. pylori infection. Thus, in addition to high risk of DGC occurrence, this environment could encourage intestinal-type gastric carcinogenesis by prolonging acid depletion time from a less atrophic period of H. pylori infection of the stomach. Secondly, as our study showed no difference in RHG status between patients with closed and open-type EAB, RHG was not a simple acute aspect of H. pylori-associated inflammation but could be a long-standing feature of inflammation in certain patients with advanced atrophy, and this might increase the risk of DGC even in persons with open-type EAB.
There are some limitations to this study. This was a single-center study, which means the incidence of RHG might be affected by geographical or age-related bias; secondly, the gastric acid level was estimated by an indirect serological method. Multicenter studies across the country with direct measurements of gastric acid levels are needed in future; the findings of such studies can help physicians identify patients at high risk of GC based on acid status.
Notes
Conflicts of Interest: The authors have no financial conflicts of interest.
Funding
None.
Author Contributions
Conceptualization: Byung Chul Kim
Data curation: BCK, Mi Ae Song
Formal analysis: BCK, MAS, Sung Ho Kwon
Investigation: BCK, MAS, SHK
Methodology: BCK, MAS, SHK
Project administration: BCK
Resources: BCK, MAS
Software: SHK
Supervision: BCK
Validation: BCK, MAS
Visualization: BCK, MAS, SHK
Writing-original draft: BCK, MAS
Writing-review&editing: BCK, MAS, SHK