Endoscopic versus surgical management for colonic volvulus hospitalizations in the United States
Article information

Abstract
Background/Aims
Colonic volvulus (CV), a common cause of bowel obstruction, often requires intervention. We aimed to identify hospitalization trends and CV outcomes in the United States.
Methods
We used the National Inpatient Sample to identify all adult CV hospitalizations in the United States from 2007 to 2017. Patient demographics, comorbidities, and inpatient outcomes were highlighted. Outcomes of endoscopic and surgical management were compared.
Results
From 2007 to 2017, there were 220,666 CV hospitalizations. CV-related hospitalizations increased from 17,888 in 2007 to 21,715 in 2017 (p=0.001). However, inpatient mortality decreased from 7.6% in 2007 to 6.2% in 2017 (p<0.001). Of all CV-related hospitalizations, 13,745 underwent endoscopic intervention, and 77,157 underwent surgery. Although the endoscopic cohort had patients with a higher Charlson comorbidity index, we noted lower inpatient mortality (6.1% vs. 7.0%, p<0.001), mean length of stay (8.3 vs. 11.8 days, p<0.001), and mean total healthcare charge ($68,126 vs. $106,703, p<0.001) compared to the surgical cohort. Male sex, increased Charlson comorbidity index scores, acute kidney injury, and malnutrition were associated with higher odds of inpatient mortality in patients with CV who underwent endoscopic management.
Conclusions
Endoscopic intervention has lower inpatient mortality and is an excellent alternative to surgery for appropriately selected CV hospitalizations.
INTRODUCTION
Large bowel obstruction is a frequent cause of hospitalization and may occur due to various benign or malignant causes.1 Colonic volvulus (CV) refers to an axial rotation of a mobile colonic segment along with the vasculature around a fixed base, creating a closed loop mechanical intestinal obstruction.2 This may further lead to hemodynamic compromise and bowel ischemia, resulting in gangrene formation.2 The sigmoid colon and cecum are the most common sites of CV.1 Risk factors for the development of CV include chronic constipation, abdominal surgeries, previous history of volvulus, and megacolon.3 Additionally, elderly patients, nursing home residents, and those with neuropsychiatric conditions are at increased risk.4,5
In the United States (US), CV is the third most common cause of bowel obstruction in colorectal cancer and diverticulitis, accounting for approximately 3.5% of all bowel obstructions.3,6 Over the years, the incidence of sigmoid volvulus has remained relatively stable (1.9%); however, the incidence of cecal volvulus continues to increase by 5.53% annually.7 This rising incidence may be attributed to the increasing medical comorbidities and complexity of patients. Although there is an apparent increase in the incidence of CV, the clinical outcomes of patients with CV in an inpatient setting are largely unknown. Furthermore, in the era of minimally invasive interventions, it is essential to understand the utilization and compare the clinical outcomes of endoscopic and surgical management options for CV. Therefore, our study aimed to identify hospitalization characteristics, comorbidities, and inpatient outcomes for CV hospitalization. We also compared hospitalization characteristics and clinical outcomes of endoscopic and surgical management strategies for CV and identified independent predictors of inpatient mortality for both management strategies.
METHODS
Design and data source
The study cohort was obtained from the National Inpatient Sample (NIS) database. As part of the Healthcare Cost and Utilization Project, the NIS gathers data on inpatient admissions submitted by hospitals across the US to state-wide data organizations, covering more than 95% of the US population.8 It approximates a 20-percent stratified sample, and the data were weighted to obtain national estimates.9 For the 2007–2017 study period, the database was coded using the International Classification of Diseases (ICD)-9 and ICD-10 coding systems.
Study population
We identified all adult (≥18 years) hospitalizations with a primary discharge diagnosis of CV in the US from 2007 to 2017. These hospitalizations were further divided into two subgroups based on endoscopic or surgical management for comparative analysis. Endoscopic management primarily consisted of endoscopic detorsion via sigmoidoscopy or colonoscopy. Surgical management was defined as surgical resection of the bowel segment. Patients who underwent surgery after failure of endoscopic management were included in the surgical management subgroup for the analysis.
Statistical analysis and outcome measures
Statistical analysis was conducted using Statistical Analysis System (ver. 9.4; SAS Institute Inc.) while accounting for the weights in the stratified survey design. The weights were considered during statistical estimation by incorporating variables for strata (stratum used to post-stratify hospitals), cluster (Healthcare Cost and Utilization Project hospital identification number), and weight (weight to discharges) in the NIS database. Descriptive statistics were provided, including the mean (standard deviation) for continuous variables and count (percentage) for categorical variables. The Cochran-Armitage trend test was used to test the trend of the proportions of the binary variables in years. The trend of the averages of the continuous variables in years was examined using linear regression. The Rao-Scott design-adjusted chi-square test, which considers a stratified survey design, examined the association between two categorical variables. Differences in the means for age, length of stay (LOS), and total healthcare charge (THC) between the endoscopic and surgical interventions were tested using F-statistics from the weighted regression model. Adjusted hazard ratios with 95% confidence intervals were obtained through Cox proportional hazard regression, which modeled factors that influenced age at death. All analytical results were considered statistically significant at p≤0.05. We report no missing data for the analyzed variables.
Ethical statements
The NIS database lacks patient- and hospital-specific identifiers. Hence, this study was exempt from the institutional review board (IRB) review, as per the guidelines put forth by our institutional IRB for research on database studies. Hence, no consent was required for NIS studies.
RESULTS
Hospitalization characteristics for CV hospitalizations
Between 2007 and 2017, there were 220,666 hospitalizations for CV in the US. There was a trend toward increasing total CV hospitalizations in the US, from 17,888 in 2007 to 21,715 in 2017 (p=0.0006). CV hospitalizations for males increased from 43.8% in 2007 to 45.4% in 2017 (p<0.0001). Patients aged 50 to 79 years and those with a Charlson comorbidity index (CCI) score ≥3 (Fig. 1) were noted to have a rising trend of CV hospitalization (Table 1). Although Caucasians comprised the majority of the study cohort, there was a trend toward decreasing CV hospitalizations in Caucasians from 76.4% in 2007 to 73.3% in 2017 (p<0.0001). However, CV hospitalizations for Blacks and Hispanics continued to increase during the study period. We also noted an increasing trend in CV hospitalizations for patients with chronic constipation, opioid use, Parkinson’s disease, anxiety, depression, epilepsy, multiple sclerosis (MS), migraines, and attention-deficit/hyperactivity disorder (Table 1).
Trends of Charlson comorbidity index (CCI) for colonic volvulus-related hospitalizations in the United States from 2007 to 2017.
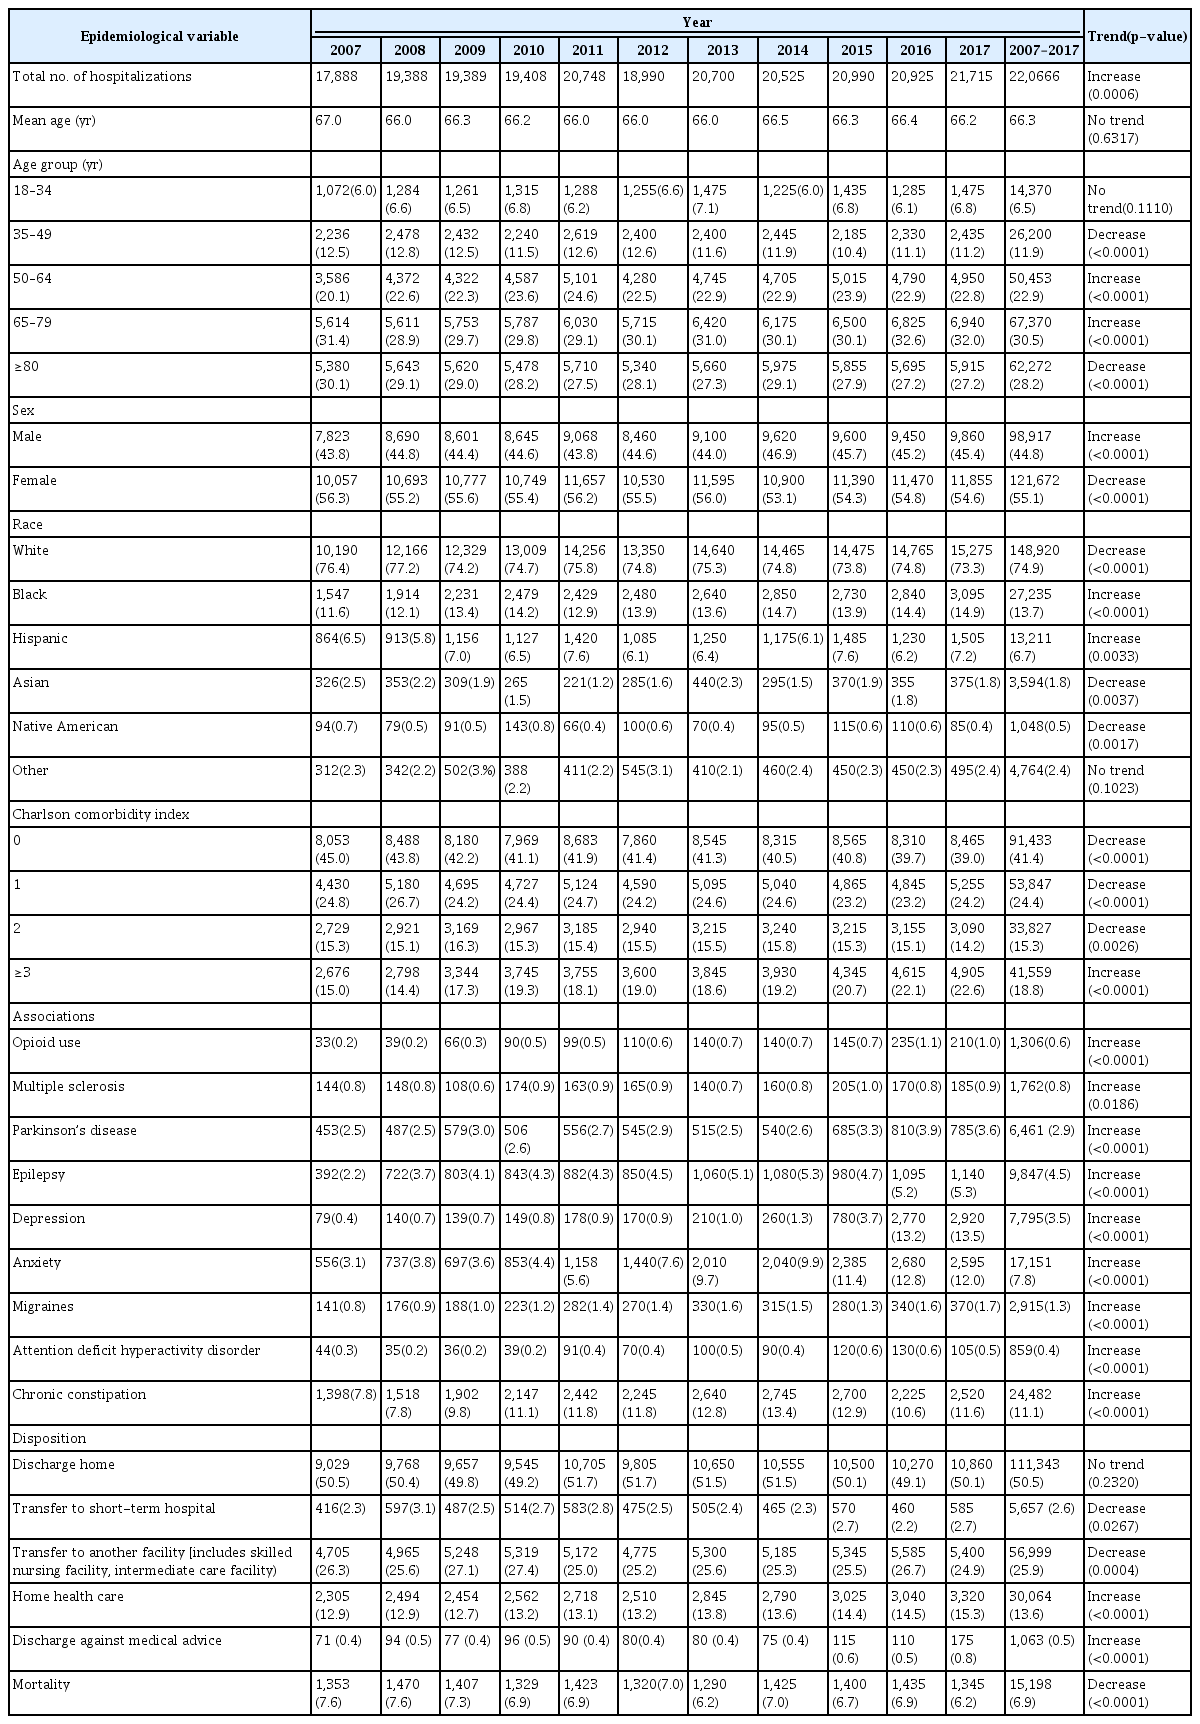
Hospitalization characteristics for colonic volvulus in the United States from 2007 to 2017
Inpatient mortality and healthcare utilization for CV hospitalizations
In the US, inpatient mortality for CV hospitalizations decreased from 7.6% in 2007 to 6.2% in 2017 (p<0.0001) (Table 2). Inpatient mortality in males decreased from 9% in 2007 to 6.5% in 2017 (p<0.0001) and in females from 6.5% to 6% (p<0.0001). Furthermore, we noted a decreasing trend in inpatient mortality in the Caucasian, Black, and Hispanic populations (Table 2). The mean LOS decreased from 10.2 days in 2007 to 8.8 days in 2017 (p<0.0001). However, the mean THC increased from $64,447 in 2007 to $100,928 in 2017 (p<0.0001) for CV hospitalizations.
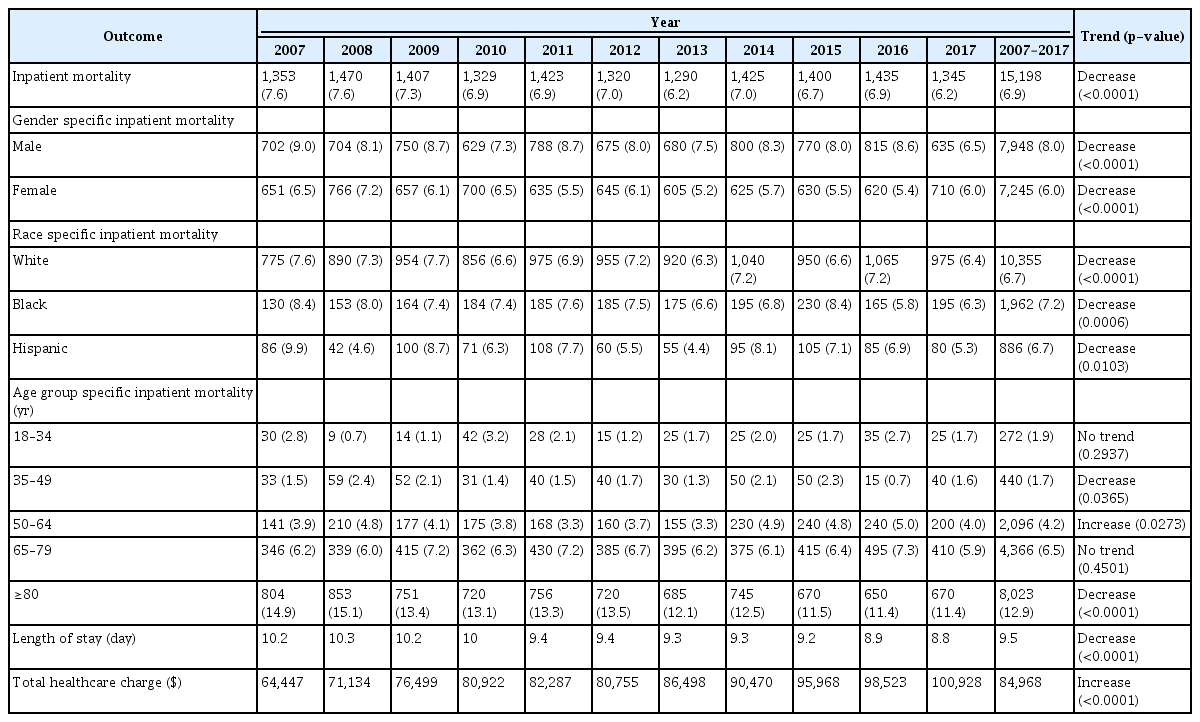
Trends of inpatient mortality for patients with colonic volvulus in the United States from 2007 to 2017
A comparative analysis of endoscopic versus surgical management of CV patients
During the study period, 13,745 patients hospitalized for CV underwent endoscopic intervention, whereas 77,157 were managed with surgery. Patients in the surgical cohort were older (70.1 vs. 66.3 years, p<0.0001) than those in the endoscopic intervention cohort. From a racial perspective, a higher proportion of Blacks and Hispanics underwent endoscopic intervention, while a higher proportion of Caucasians underwent surgery (Table 3). Furthermore, endoscopic management was more frequent in CV patients with high CCI scores and associated comorbidities (Tables 3, 4). Meanwhile, a higher proportion of CV patients with low CCI scores required surgical resection.
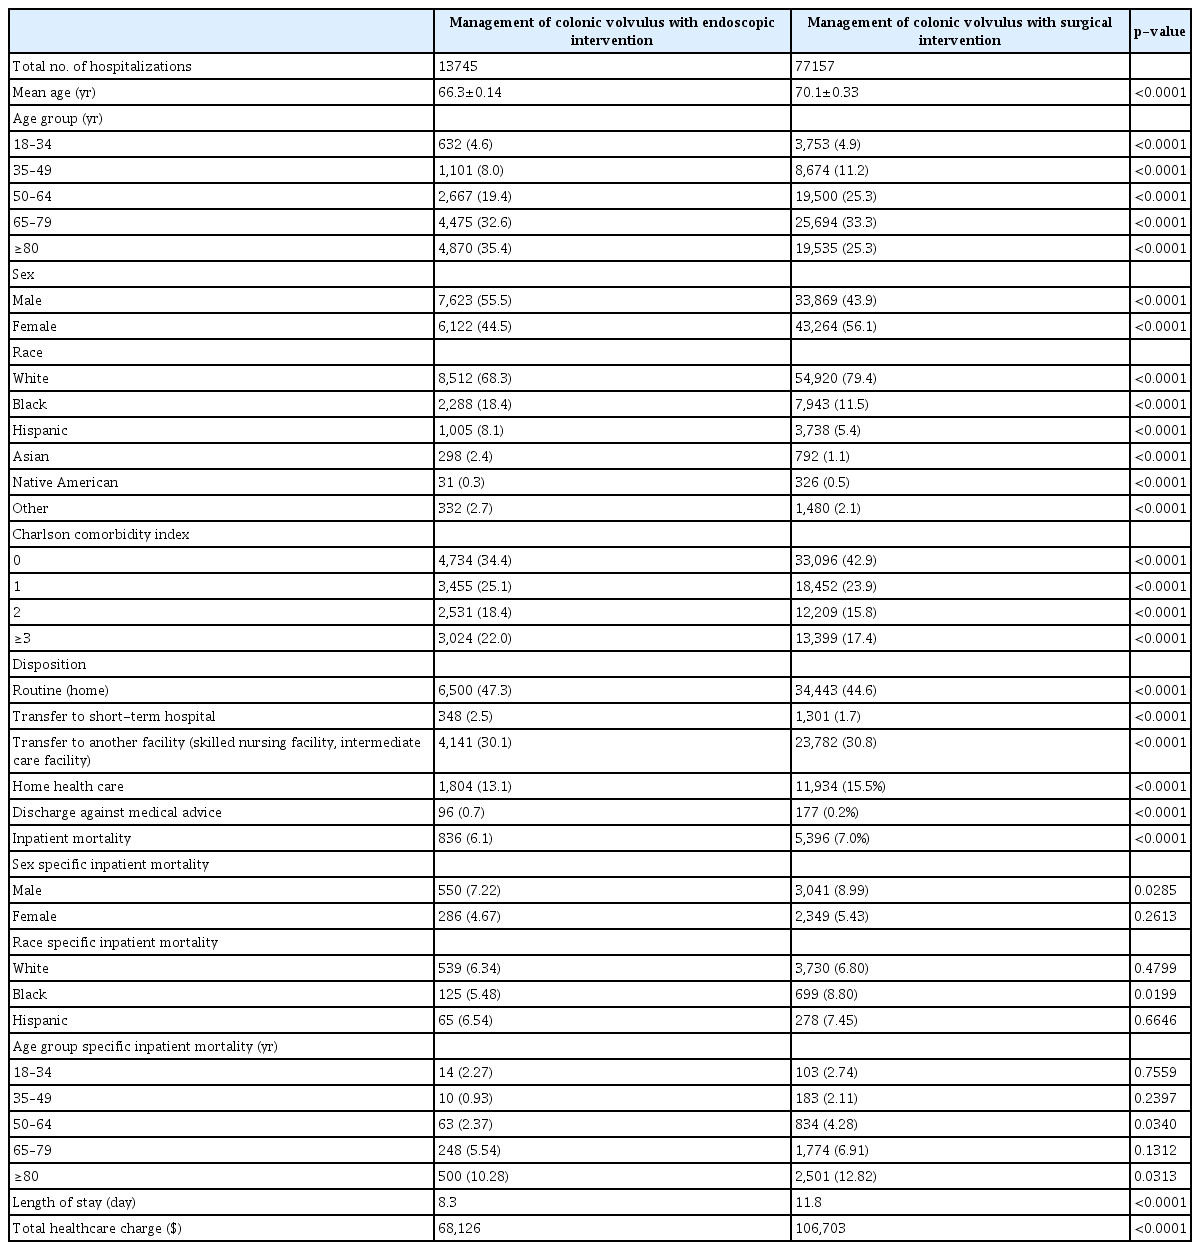
Comparative analysis of endoscopic intervention and surgical intervention for colonic volvulus in the United States from 2007 to 2017

Comparative analysis of comorbidities associated with endoscopic intervention and surgical intervention for colonic volvulus in the United States from 2007 to 2017
The endoscopic intervention cohort had a lower all-cause inpatient mortality (6.1% vs. 7.0%, p<0.0001), shorter mean LOS (8.3 vs. 11.8 days, p<0.0001), and lower mean THC ($68,126 vs. $106,703, p<0.0001) than the surgical cohort, despite a higher proportion of patients with high CCI scores and associated comorbidities. Additionally, in the endoscopic intervention cohort, the inpatient mortality for Blacks was significantly lower (5.48% vs. 8.80%, p=0.0199) than that in the surgical cohort.
Predictors of inpatient mortality for endoscopic management of CV hospitalizations
For endoscopic CV management, males had a 70.9% higher mortality risk than females after adjusting for other variables. Increased CCI scores were also associated with increased risk of inpatient mortality (Table 5). Furthermore, for patients hospitalized for CV that underwent endoscopic management, the presence of acute kidney injury and malnutrition were associated with a 230.5% and 58.4% higher risk of inpatient mortality, respectively, than those without these complications, after adjusting for confounders such as patient and hospital characteristics.
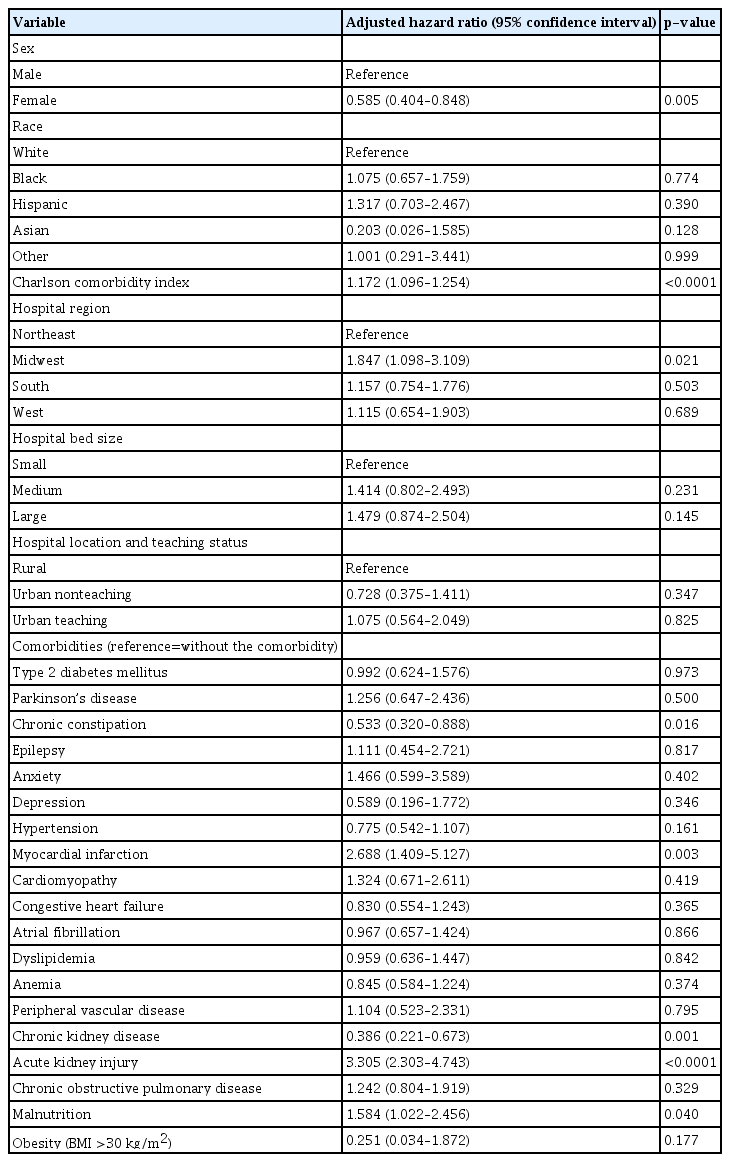
Predictors of inpatient mortality for management of colonic volvulus with endoscopic intervention in the United States from 2007 to 2017
Predictors of inpatient mortality for surgical management of CV hospitalizations
For surgical CV management, males had a 19.9% higher mortality risk than females after adjusting for other variables. Additionally, for patients hospitalized for CV that underwent surgical management, the presence of acute kidney injury, chronic obstructive pulmonary disease, malnutrition, and obesity were associated with 249.6%, 29.9%, 20.4%, and 56.4% higher risks of inpatient mortality, respectively, than those without these complications, after adjusting for confounders such as patient and hospital characteristics (Table 6).

Predictors of inpatient mortality for surgical management of colonic volvulus in the United States from 2007 to 2017
DISCUSSION
Our study noted a rising trend of CV hospitalizations from 17,888 in 2007 to 21,715 in 2017, with a decline in overall all-cause inpatient mortality. Despite a higher proportion of patients with CCI score ≥1 and associated comorbidities, endoscopic management had lower inpatient mortality, shorter mean LOS, and lower mean THC than surgical management for CV hospitalizations. The identification of trends, associations, clinical outcomes, and a comparative analysis of treatment strategies for CV hospitalizations is essential, as it provides gastroenterologists with real-world data on patients who might be at the highest risk of developing CV and those who may benefit the most from minimally invasive endoscopic interventions compared to conventional surgery.
Previous studies have reported that patients with chronic constipation, opioid users, and older patients are more likely to develop CV compared to the general population.10-12 Additionally, there is a higher likelihood of CV in patients with neuropsychiatric disorders.13 In this study, we observed a rise in CV hospitalizations for patients with chronic constipation from 7.8% in 2007 to 11.6% in 2017 and for opioid users from 0.2% in 2007 to 1% in 2017 (Fig. 2). A higher proportion of CV hospitalizations for patients with chronic constipation underwent endoscopic intervention than surgical resection (18.7% vs. 11.4%, p<0.0001). This may, in part, be because the endoscopic detorsion was adequate and successful in these patients. Hence, additional emergent surgical intervention was not warranted. Furthermore, we did not find a statistically significant difference between the endoscopic and surgical management of opioid users. For patients with neuropsychiatric disorders such as Parkinson’s disease and epilepsy, a higher proportion of patients underwent endoscopic intervention than surgical resection (Table 4). This may have been due to the poor surgical candidacy of patients with neuropsychiatric disorders and an increased risk associated with surgical intervention compared to the minimally invasive nature of endoscopic procedures.

Trends of inpatient mortality, opioid use, and chronic constipation for colonic volvulus-related hospitalizations in the United States from 2007 to 2017.
Although patients may undergo endoscopic detorsion for CV, surgical resection is warranted in severe cases to prevent recurrence. Hence, there are more surgical resections compared to non-surgical decompression for CV.7 Our study echoes these findings as we noted that only 13,745 CV hospitalizations underwent endoscopic management, while 77,157 patients underwent surgical resection. Patients in the surgical cohort were 3.8 years older than those in the endoscopic cohort. This may be due to the recurrent episodes or severe ischemia from bowel obstruction requiring immediate surgical resection which are typically seen in older patients.14 Interestingly, we noted that a higher proportion of patients ≥80 years old underwent endoscopic intervention compared to surgical resection. This may be because these patients are poor surgical candidates for abdominal surgery and have a high risk of procedural mortality.15 Furthermore, compared to surgical resection, endoscopic management had lower inpatient mortality (Table 3), which can be attributed to the invasive nature of surgery and post-surgical complications. However, it is worth noting that we observed lower inpatient mortality rates (7%) for surgical resection compared to other studies in the current literature, which reported mortality rates as high as 15% after the first resection and 9% after recurrent volvulus requiring surgery.16 This may, in part, be due to standardization and improvement in surgical techniques and increased surgical experience with CV due to the rising hospitalization rates.
Endoscopic therapy for CV may be appropriate in patients with multiple comorbidities despite surgical resection being the traditional practice.17 However, immediate surgical intervention is warranted if bowel perforation or gangrene is suspected.17 In our study, a higher proportion of patients with CCI scores ≥1 and associated comorbidities underwent endoscopic intervention, while those with a lower comorbidity burden underwent surgical resection (Fig. 3). However, the endoscopic cohort had a lower inpatient mortality rate. This finding was in line with the current literature.18 It suggests that the endoscopic approach may be a better alternative for patients with a high comorbidity burden. After adjusting for confounders, we noted that male sex, increased CCI scores, acute kidney injury, and malnutrition were associated with a higher risk of inpatient mortality in patients undergoing endoscopic intervention for CV; however, the presence of neuropsychiatric disorders was not associated with an increased risk of inpatient mortality in these patients. Furthermore, for surgical management, male sex, increased CCI scores, acute kidney injury, chronic obstructive pulmonary disease, malnutrition, and obesity were associated with a higher risk of inpatient mortality, after adjusting for patient and hospital characteristics.

Comparison of Charlson comorbidity index (CCI) for endoscopic and surgical management of colonic volvulus-related hospitalizations in the United States from 2007 to 2017.
During the 2007–2017 study period, the mean LOS for CV hospitalizations decreased from 10.2 days in 2007 to 8.8 days in 2017. This may be attributed to improved inpatient management strategies and the widespread availability of endoscopic intervention, which is a less invasive approach for CV. However, the mean THC for CV hospitalization increased from $64,447 in 2007 to $100,928 in 2017. This may, in part, be secondary to the involvement of a multidisciplinary team of specialists and ancillary healthcare professionals in managing complex patients and complications. Moreover, compared with surgical management, the endoscopic intervention cohort had a shorter mean LOS (8.3 vs. 11.8 days, p<0.0001) and lower mean THC ($68,126 vs. $106,703, p<0.0001). This is likely due to faster recovery times and fewer days in the intensive care unit for patients managed with endoscopic interventions.
This study has several strengths and limitations. The study population, derived from a large, multi-ethnic, publicly available database, was a key strength of this study. The NIS database contains information on inpatient hospital stays from hospitals across the US, covering 97% of the US population. Hence, the outcomes derived from this study are applicable and generalizable to hospitalizations in the US. The 11-year study period from 2007 to 2017 allowed us to establish meaningful trends and outcomes, in addition to the current literature. Additionally, through the unique study design, we not only focused on hospitalization characteristics, clinical outcomes, and associations of CV but also compared the differences in endoscopic and surgical management for CV. This allowed for extensive analysis and helped to assess the disease entity thoroughly. Despite its numerous strengths, we acknowledge the limitations of our study. The NIS database does not contain data on the severity of CV, the methods used to establish a diagnosis, or the hospital course. We were unable to assess the impact of pharmacotherapy in the management of CV, which could have impacted the findings of this study. Finally, the NIS is an administrative database that uses ICD codes to store information; hence, the possibility of coding errors cannot be excluded. Despite these limitations, the large sample size, unique methodology, and comprehensive analysis techniques help us to better understand the disease entity. This article aims to stimulate conversations and promote further research on CV.
In conclusion, there was an increase in CV hospitalizations between 2007–2017; however, all-cause inpatient mortality declined. In addition to other risk factors, CV hospitalization for patients with chronic constipation and opioid use has increased. Endoscopic therapy was associated with lower inpatient mortality, LOS, and THC than surgery. In the absence of colonic ischemia or perforations associated with CV, endoscopic therapy may be an excellent alternative to surgery in appropriately selected patients and should be offered as a treatment modality for CV hospitalization.
Notes
Conflicts of Interest
The authors have no potential conflicts of interest.
Funding
None.
Acknowledgments
We analyzed the NIS database from 2007 to 2017, available online at http://www.hcupus.ahrq.gov. The NIS is a large publicly available all-payer inpatient care database in the US that contains data on more than seven million hospital stays annually. Its large sample size is ideal for developing national and regional estimates, and enables analyses of rare conditions, uncommon treatments, and special populations.
Author Contributions
Conceptualization: DSD, AP, HG, NRS; Data curation: DSD, CIC; Formal analysis: CIC; Investigation: all authors; Methodology: DSD, AP, HG, CIC, NRS; Project administration: DSD, MAH, MRS, NRS; Resources: DSD, CIC; Software: CIC; Supervision: DSD, MAH, MRS, NRS; Validation: all authors; Visualization: all authors; Writing–original draft: DSD, AP, HG; Writing–review & editing: all authors.